Nano Banana scientific figures are best approached as conceptual drafts: method diagrams, research workflows and graphical abstracts. Start with a verified figure brief, generate a layout draft, then check every label and relationship before preparing the final export.
Google DeepMind's model card is dated October 6, 2026. The Gemini API documentation lists the model as gemini-nano-banana-2.1 and describes improvements in text rendering and infographic layout accuracy. Those changes are relevant to labeled research diagrams, but relevance is an inference, not a scientific benchmark.
This guide provides a workflow and original prompt templates. We have not run a controlled scientific-figure evaluation of Nano Banana 2.1. The illustrations were created with the built-in image_gen tool to explain this workflow; they are not Nano Banana 2.1 outputs.
Original AI-generated editorial illustration. The sketch symbols do not represent measured data.
Which research figures should you try first?
A useful first task has a small number of objects, explicit relationships and short labels. You should be able to write its scientific meaning in plain text before asking the model to draw it.
| Figure task | What to give the model | What to verify |
|---|---|---|
| Method overview / Figure 1 | Modules, inputs, outputs and directed connections | Missing stages, reversed arrows and unintended feedback loops |
| Graphical abstract | Research question, approach and one supported takeaway | Whether the visual overstates the result |
| Biological mechanism schematic | Verified entities, compartments and signed relationships | Location, activation versus inhibition and evidence status |
| Experimental workflow | Ordered steps and real branch conditions | Step order, sample identity and branch labels |
For measured plots, make the chart directly from your data with a plotting tool. A plausible-looking generated axis or error bar cannot replace a calculation. If a diagram needs an exact connectivity pattern or exact screening counts, use a structured diagram tool and inspect its output.
Step 1: Write a figure brief before a style prompt
Start with the claim the reader should understand. “Draw a beautiful scientific figure” leaves the important decisions open. A more useful brief states what exists, what connects and what must stay absent.
Here is a fictional methods example for layout practice:
Purpose: explain a document-retrieval workflow.
Objects: Query, Retriever, Evidence passages, Answer model, Answer.
Connections: Query -> Retriever; Retriever -> Evidence passages;
Evidence passages -> Answer model; Query -> Answer model;
Answer model -> Answer.
Constraint: no direct arrow from Retriever to Answer.
Labels: use the exact object names above.
Layout: left-to-right, with Query branching to two destinations.
Style: white background, dark labels, blue module outlines.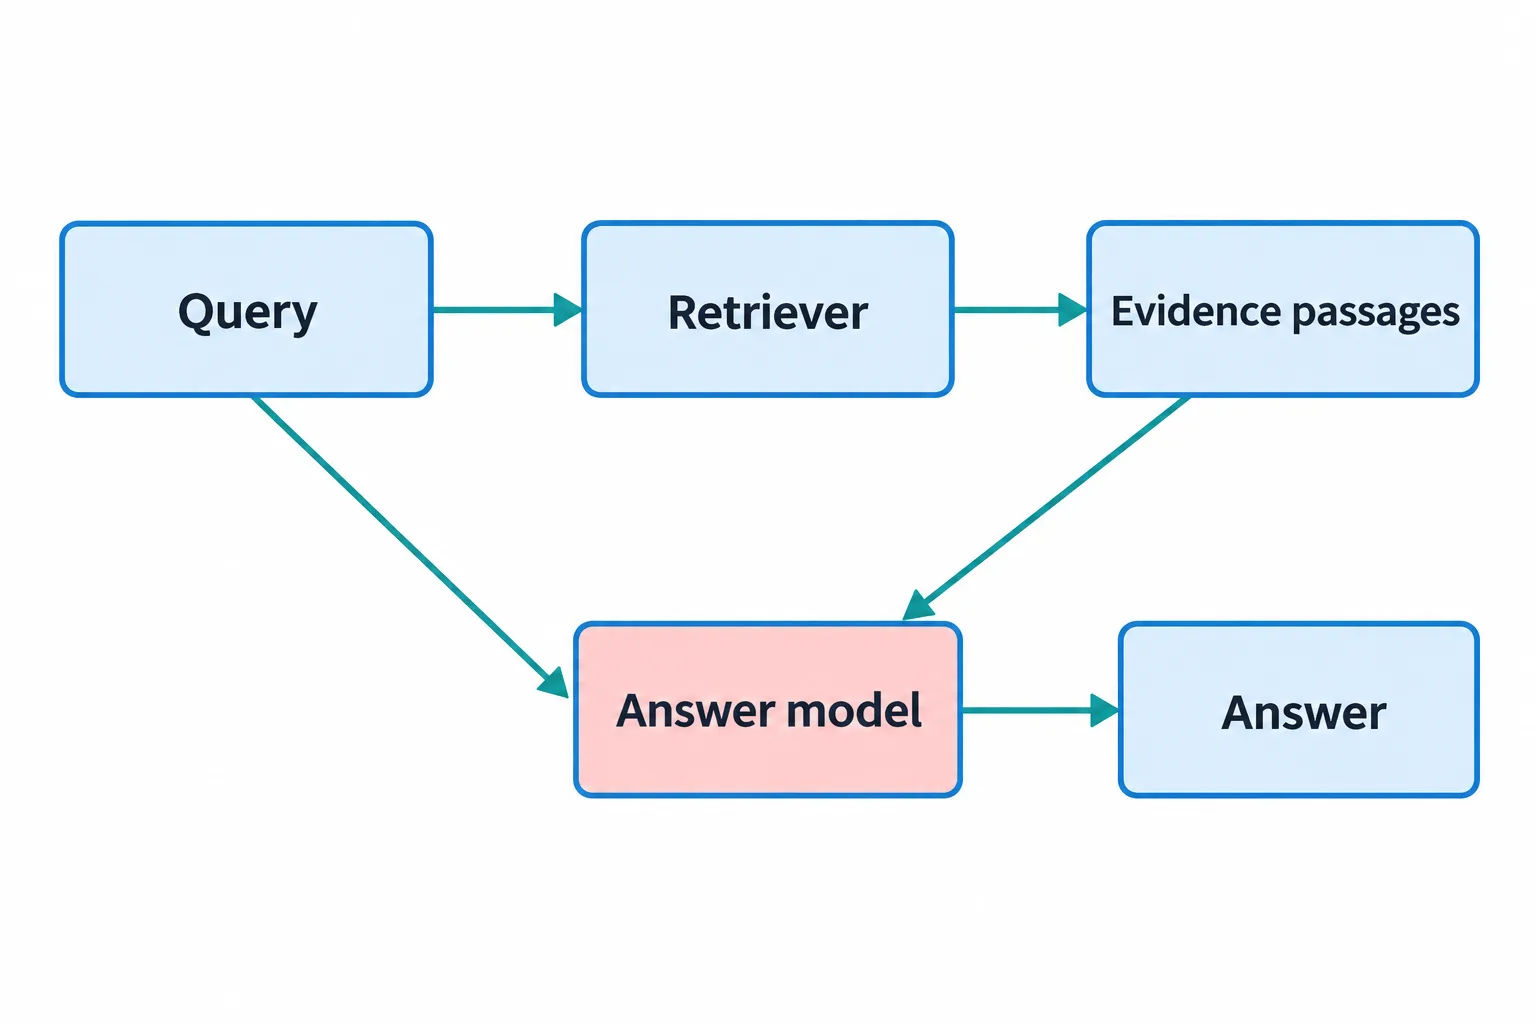
AI-generated conceptual example. We checked the five modules, five connections and labels against the brief above. This is not a Nano Banana test output. Open the full-size diagram to inspect the connectors.
The forbidden connection is as useful as the requested ones: it gives you a concrete failure to look for. Replace these objects and connections with your actual method.
Step 2: Generate the simplest readable layout
Open Google AI Studio and check which image models your account exposes. Select Nano Banana 2.1 when available, paste the brief and generate a draft. If your interface offers output-size controls, choose them there; a request for “4K” inside a prompt is not a substitute for configuring the generation setting.
For a complex pipeline, sketch the boxes and arrows first and use the sketch as a layout reference where supported. Assign each reference a purpose: one for topology, another for colors. A style reference should not introduce scientific content.
Our six Figure 1 layout patterns can help you choose between a linear pipeline, layered architecture and other arrangements. Keep that decision separate from the choice of icons.
Step 3: Review meaning before appearance
Compare the draft against the brief in three passes:
- Objects: count the modules and check every label, symbol and abbreviation.
- Connections: check arrow endpoints, direction and line meaning. A T-bar and an arrow should not be interchangeable.
- Claims: remove any decorative plot, molecule, measurement or conclusion that the source material did not supply.
Google's image-model limitations explicitly include factual errors and text-fidelity issues. Better visual output still needs this review.
For a scientific schematic, an extra arrow is a change to the explanation. Treat it as a substantive correction, even if the rest of the figure looks convincing.
Step 4: Revise one failure at a time
Use a specific correction prompt:
Revise the supplied draft. Remove only the arrow from Retriever to Answer.
Keep the five modules, their exact labels, the Query branches,
all other connections, the colors and the overall layout unchanged.
Do not add new objects or text.
This requests preservation; it does not guarantee it. Recheck the whole figure after each edit. Keep the previous draft so you can compare changes or return to it.
If you need several prompt starting points, use our scientific diagram prompt library. For a paper summary rather than a methods figure, follow the graphical abstract tutorial.
Worked example: a graphical abstract with a scoped claim
Suppose a fictional study finds fewer irrelevant retrieved passages after adding a relevance filter, on a specified test collection. That result does not establish higher answer accuracy or performance in every domain.
Write three parts: the question is irrelevant passages in retrieval; the approach is a filtering stage; the takeaway is fewer irrelevant passages in the test collection. Keep that last qualification visible.
Create a three-panel conceptual graphical abstract of a fictional retrieval study.
Panel 1: show relevant and irrelevant retrieved passages. Label "Research question".
Panel 2: show Query -> Retriever -> Relevance filter -> Filtered evidence.
Label "Approach". Use those four exact module labels.
Panel 3: use the exact takeaway "Fewer irrelevant passages in the test collection".
Label "Observed result".
Use a left-to-right reading path, white background and short dark labels.
Legend: blue = relevant passage; gray = irrelevant passage.
Document-icon counts must not be presented as quantitative results.
Do not add answer-accuracy claims, percentages, plots or performance badges.
Check the result panel first, then trace the method. Remove any unmeasured accuracy claim or numerical-looking chart. A graphical abstract summarizes a paper's evidence; measured plots should still be drawn directly from data.
The graphical abstract generator can also take this kind of brief using its currently listed model. Before choosing an AI-image workflow for submission, check the target journal's current author instructions, artwork rules and disclosure requirements.
Step 5: Prepare the export at its intended size
Place the image into your paper or slide at its actual display size. Check whether labels remain readable, arrows remain distinct and the diagram still works without color.
Raster size and print density are different quantities. An image 2,400 pixels wide placed at 8 inches has an effective density of 300 pixels per inch. Changing a DPI metadata field does not add detail. Use the figure DPI calculator to work out the size you need.
Image generation also does not guarantee editable vector objects. If you need selectable labels and movable connectors, read the image-to-editable-SVG workflow and inspect the reconstructed geometry and text after conversion.
Frequently asked questions
Is Nano Banana 2.1 the same as Nano Banana 2 Lite?
They are distinct model names. Check the Nano Banana 2 Lite overview and provider documentation rather than assuming that “2.1” is a new name for Lite. This article concerns Google's documented Nano Banana 2.1 model.
Is Nano Banana 2.1 better than Nano Banana Pro for scientific figures?
We have not established that. Compare them on the same verified brief, with multiple attempts and the same evaluation criteria. Count scientific errors and revision effort alongside appearance; general image preference does not establish scientific correctness.
Can I use it through PaperBanana?
As of this article's October 7 update, we have not confirmed a Nano Banana 2.1 integration in PaperBanana. Use Google's available access surfaces to try that specific model. For the existing research-figure workflow, open PaperBanana and choose a model actually listed in the interface.