
AI scientific figure generator
Describe the figure your paper needs and get a publication-style draft of your scientific illustration or diagram: a mechanism pathway, a methods pipeline, a model architecture or a chart. Review it, refine it, then download it.
- 10 free credits when you sign up
- Credit cost shown before you generate
- Convert results to editable SVG

No Images Generated
Scientific figure examples by field
Each example was generated from the prompt behind it. Load one into the generator and change the details to match your study.
Biology and life science

CRISPR-Cas9 Mechanism Diagram
Guide-RNA-loaded Cas9 binds protospacer, makes a double-strand break, and triggers NHEJ or HDR repair.
Use this prompt →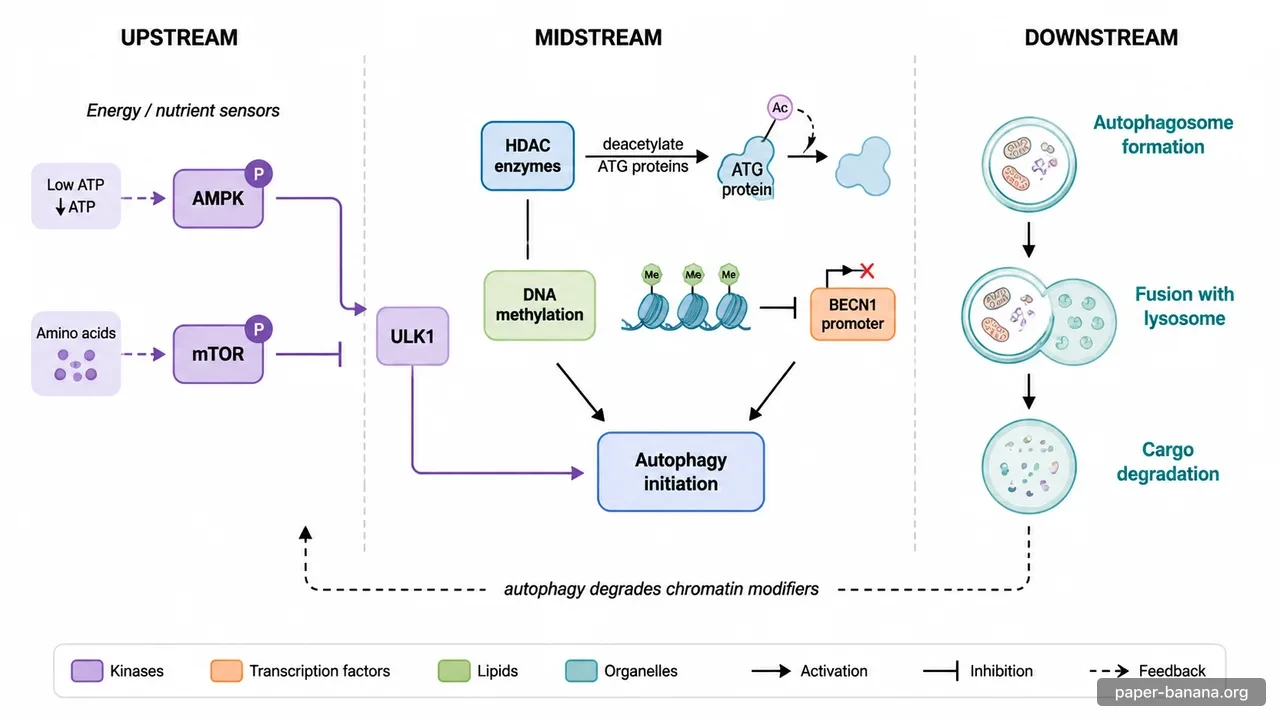
Mechanism Pathway Diagram
Cell-signaling pathway with activation and inhibition, color-coded by molecule class.
Use this prompt →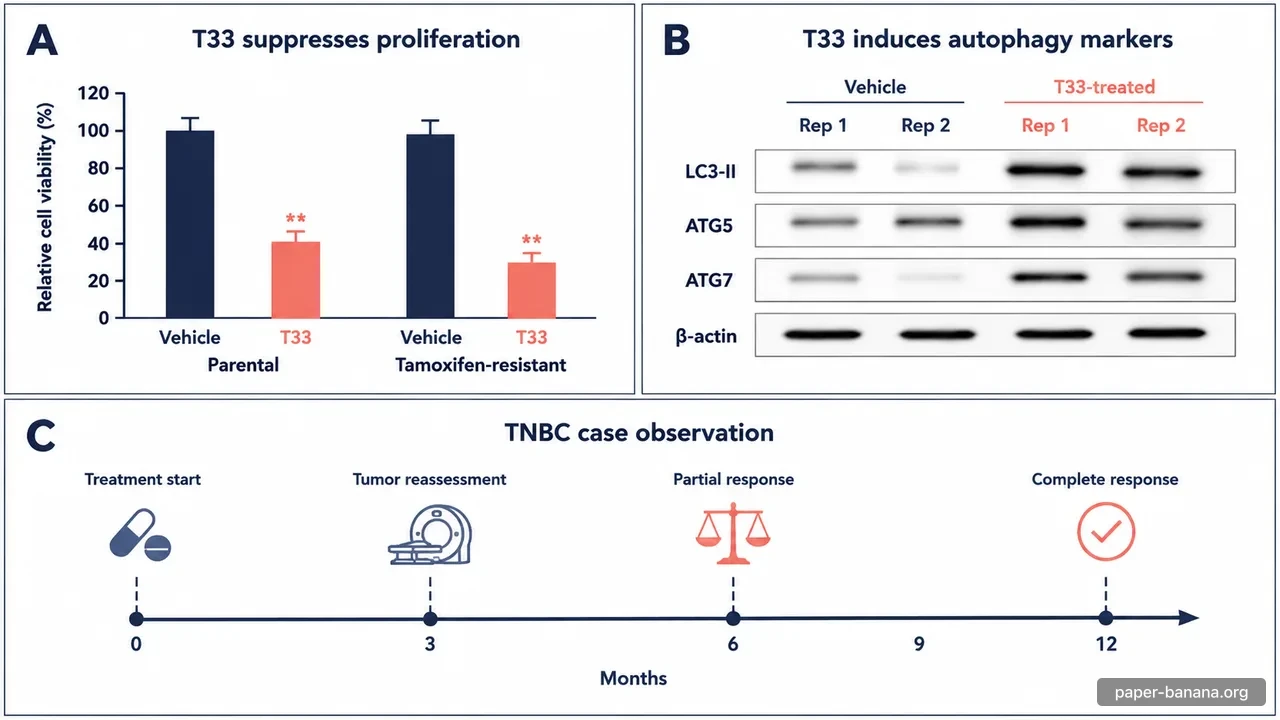
Multi-Panel Experimental Figure (A / B / C)
Three-panel composite with cell-viability, Western blot, and clinical timeline.
Use this prompt →
Medicine and pharmacology
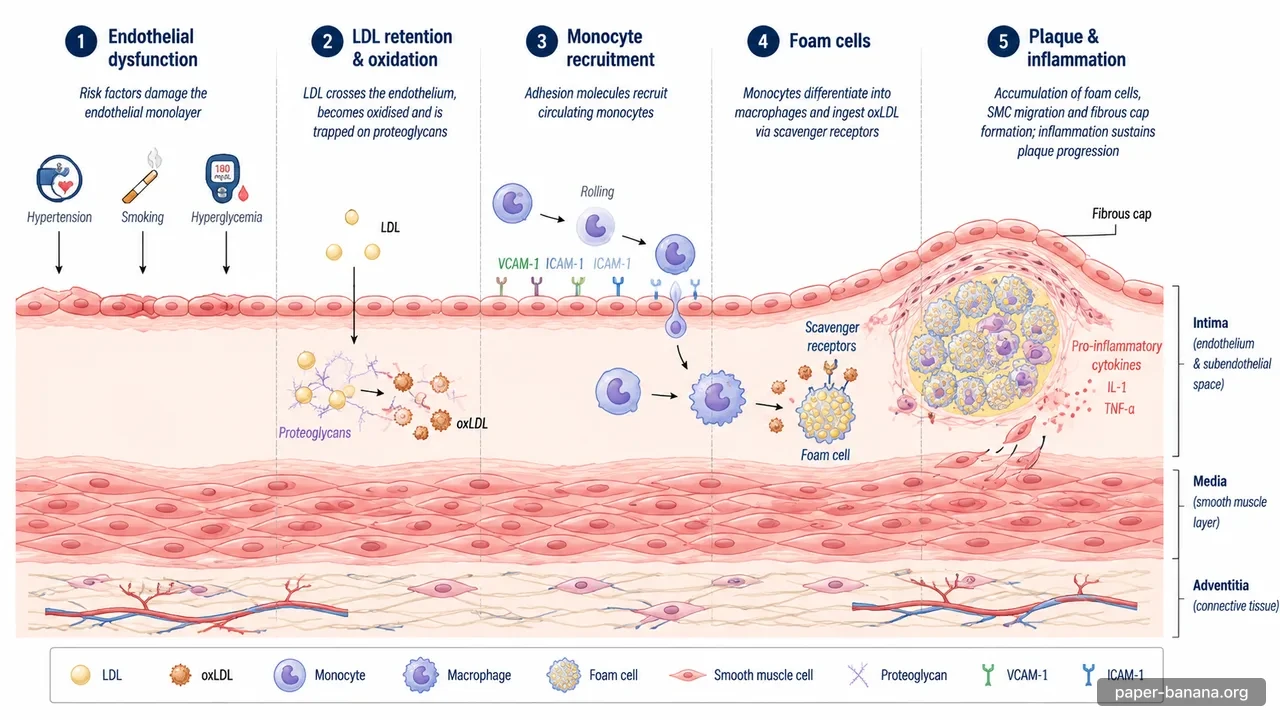
Atherosclerosis Inflammation Mechanism
Endothelial dysfunction, LDL retention, monocyte recruitment, foam cells and plaque formation.
Use this prompt →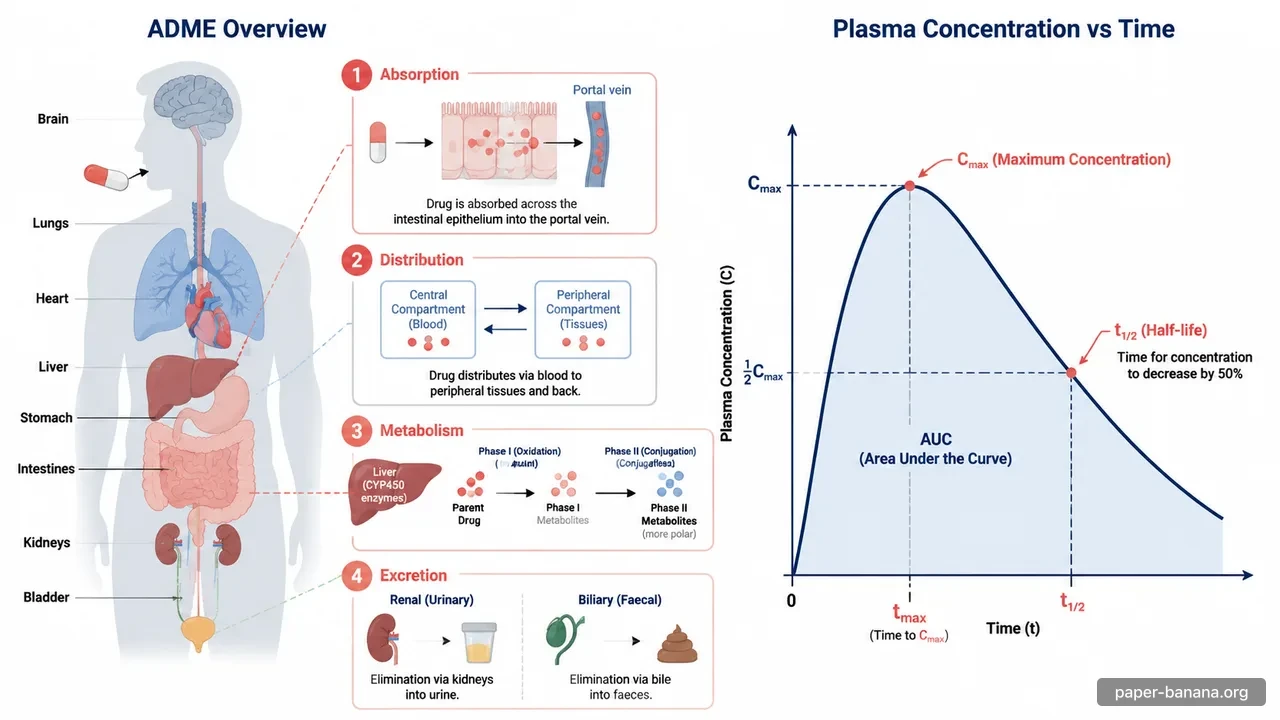
Drug Pharmacokinetics — ADME Diagram
Absorption, Distribution, Metabolism and Excretion summarised with a body schematic and a plasma curve.
Use this prompt →
Clinical Outcomes Forest Plot
Forest plot of relative risks with 95% CI for surgical complications.
Use this prompt →
Chemistry and environmental science
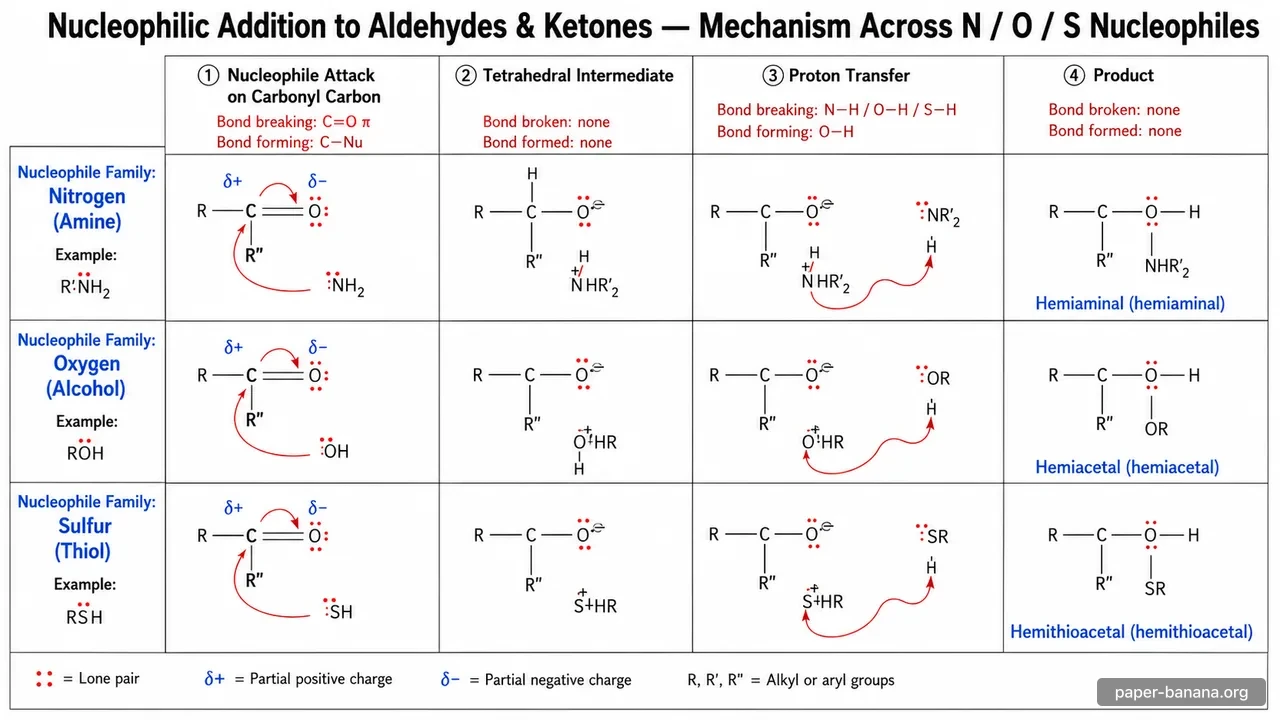
Organic Reaction Mechanism Explainer
Curly-arrow mechanism showing nucleophilic addition step by step with side-by-side analogues.
Use this prompt →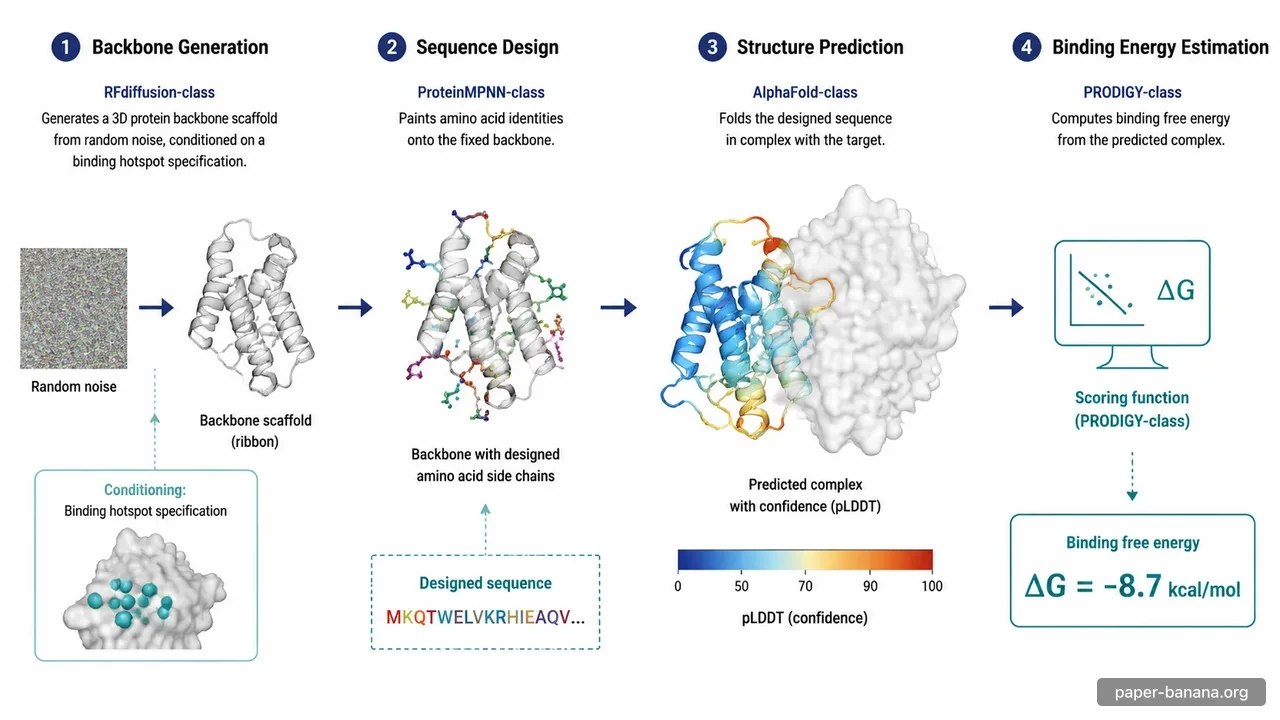
AI Protein Design Workflow
Backbone generation, sequence painting, structure prediction and binding-energy calculation.
Use this prompt →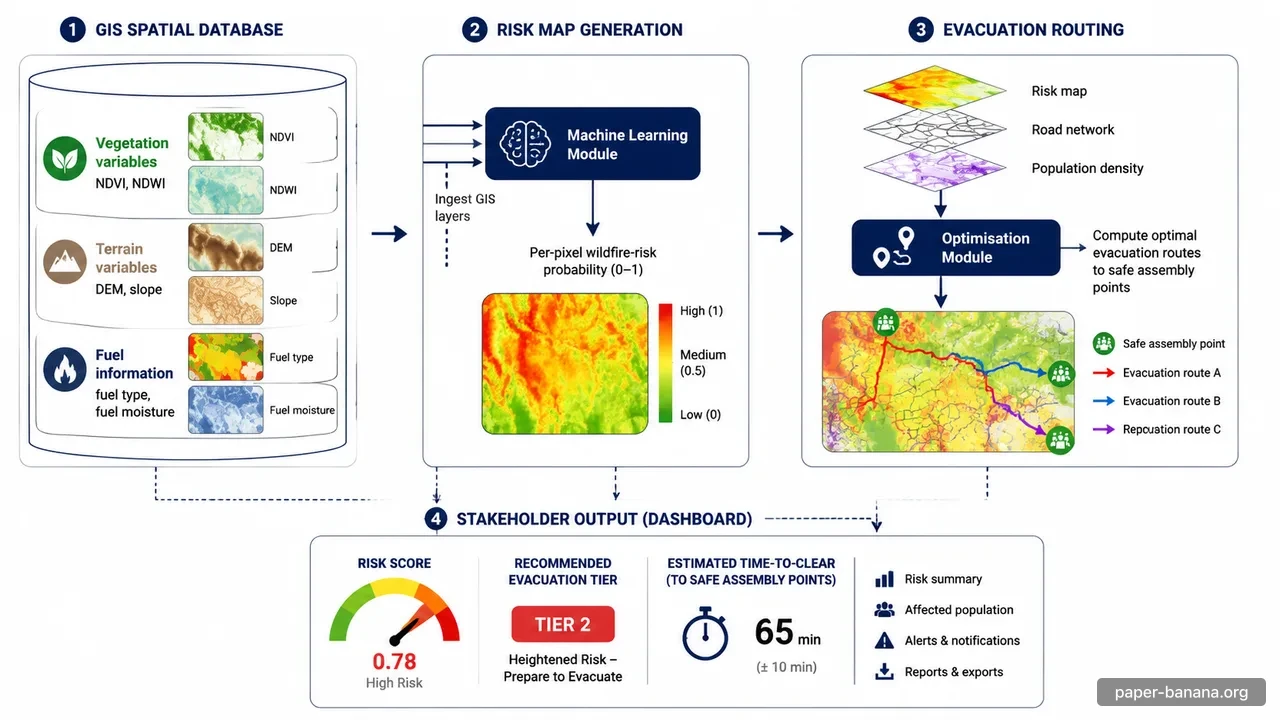
Wildfire Risk & Evacuation Framework
GIS spatial database fuels a risk-map module that drives evacuation routing.
Use this prompt →
Computer science and engineering

Transformer Encoder-Decoder Architecture
Publication-quality transformer block diagram with self-attention, cross-attention, and residual connections.
Use this prompt →
U-Net Encoder-Decoder for Segmentation
Symmetric encoder-decoder with skip connections for pixel-wise prediction.
Use this prompt →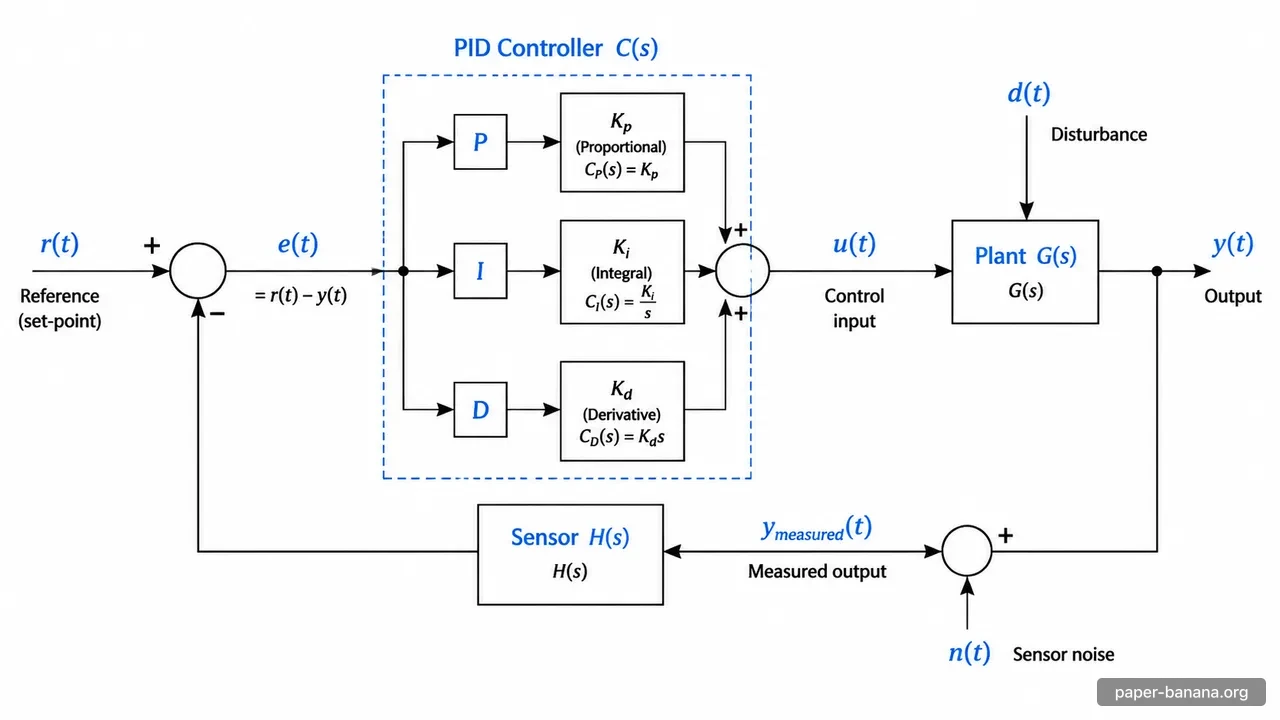
PID Control Loop
Classic feedback control loop with set-point, error, controller, plant, sensor and disturbance.
Use this prompt →
From a description to a scientific figure
- 1
Describe the figure
Name the components, the order they appear in and how they connect. Say which way arrows point and which labels must appear.
- 2
Pick a style and generate
Choose methodology diagram, statistical plot or infographic, set the aspect ratio for your journal column, and check the credit cost before you generate.
- 3
Review, edit and export
Check every label against your paper. Fix regions with the Edit tab, convert the figure to SVG if you want to keep editing it, then download.
Scientific figures you can make
The generator handles the figure types that most often appear in research papers, posters and theses.
- Mechanism and pathway diagrams
- Signaling cascades, gene editing steps, disease mechanisms and drug action, with labeled molecules and arrows.
- Methodology and pipeline figures
- Study workflows, data processing pipelines and experimental protocols laid out left to right or top to bottom.
- Model architecture diagrams
- Neural networks, system architectures and control loops for computer science and engineering papers.
- Multi-panel experimental figures
- A / B / C panel layouts that combine a schematic with result placeholders in one figure.
- Statistical charts
- Bar charts, curves and forest plots. Give the real values in your prompt and check every number in the output.
- Graphical abstracts and infographics
- A single visual summary of your study for journals, slides and teaching.
Before you put a generated figure in a paper
- Treat the output as a draft. AI image models can misspell labels, invent structures or draw arrows the wrong way, so check every element against your methods.
- For charts that report data, enter the real values and compare each bar or point with your results. For exact plots, draw them from your data.
- Check your target journal’s artwork rules for size, resolution, fonts and whether AI-generated images must be disclosed.
- Keep labels short. Long labels are where text errors are most likely, especially in Korean, Chinese and Japanese.
Image DPI calculatorHow to edit scientific figuresFigure 1 layout patterns
How it compares with BioRender and other figure tools
Icon-library tools such as BioRender give you exact control, but you assemble every element yourself. PaperBanana starts from a written description and gives you a complete draft in about a minute, which you then check and refine. Many researchers use both: a generated draft for the layout, a library tool or vector editor for the final details.
BioRender alternatives comparedFigureLabs reviewAll research figure tools
Scientific figure generator FAQ
Is the scientific figure generator free?
New accounts get 10 free credits, so you can try it without paying. Each figure uses credits, and the cost for your chosen model and resolution is shown before you generate. Paid plans add more credits.
What kinds of scientific figures can it generate?
Mechanism and pathway diagrams, methodology and pipeline figures, model architecture diagrams, multi-panel experimental layouts, statistical charts, graphical abstracts and educational infographics.
Can I publish a generated figure in a journal?
Use it as a draft and verify it before you submit. Check every label, arrow and value against your study, follow your journal’s artwork and AI-disclosure policy, and redraw anything that must be exact.
Can I edit the figure after it is generated?
Yes. The Edit tab changes parts of an image from a text instruction, and the Convert tab turns a figure into an editable SVG you can open in a vector editor.
What resolution are the figures?
Models that support it offer 1K, 2K and 4K output, at different credit costs. Use the DPI calculator to check whether a file is large enough for your journal’s print size.
Can the labels be in another language?
Yes. Choose the output language in the generator. Short labels render most reliably, especially in Korean, Chinese and Japanese.
Draft your next scientific figure
Start from your own description or one of the field examples.
Generate a scientific figure →