Lay out your board before you print anything
This science fair poster template starts from the board most fairs use: a tri-fold display board that opens to 48 × 36 inches and folds at 12 and 36 inches. The left panel holds your question, hypothesis and materials, the center panel holds the title, procedure and results graph, and the right panel holds your conclusion and sources. The gaps between columns sit on the folds, so no box is creased when you stand the board up. If your fair asks for a flat poster instead, switch to the 36 × 24 inch size and the same sections become three equal columns.
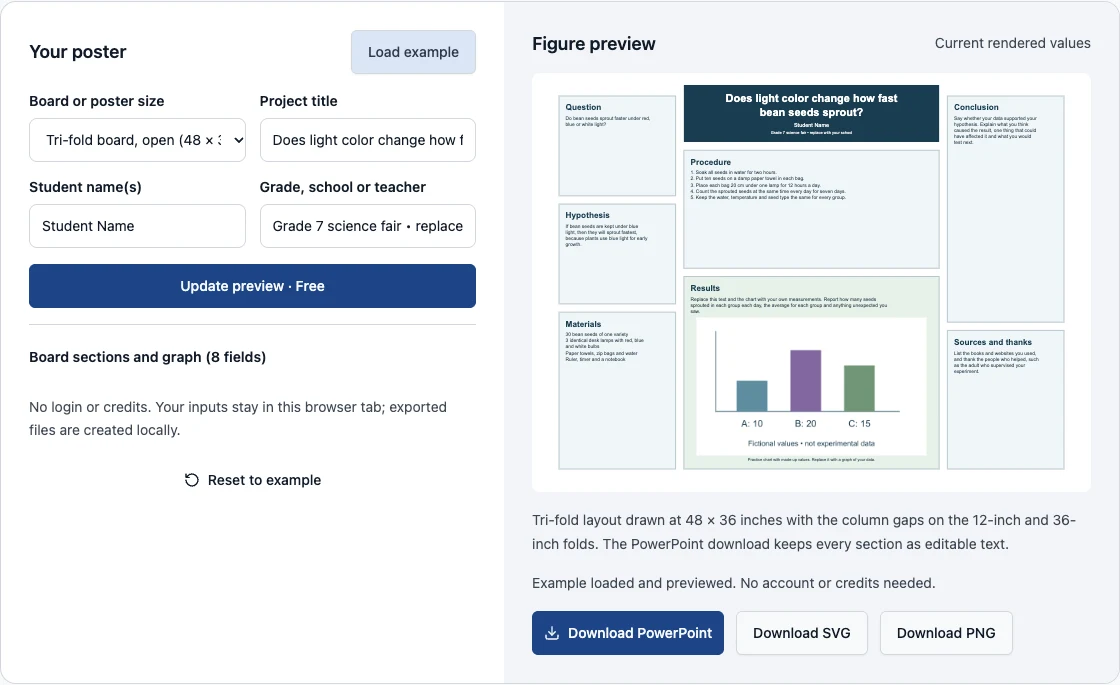
Type your own text into each section and press Update preview. The download button gives you a native PowerPoint file at the board's real size, with every heading and paragraph as an editable text box, plus SVG and PNG copies. Editing and all three downloads run in your browser and are free: there is no account, no credit cost and nothing is uploaded. If a section is too long for its box, the editor tells you which one instead of cutting the words off.
Examples you can inspect
Compare the supplied input, saved result and review points before preparing your own figure.
Example: a plant growth project on a tri-fold board
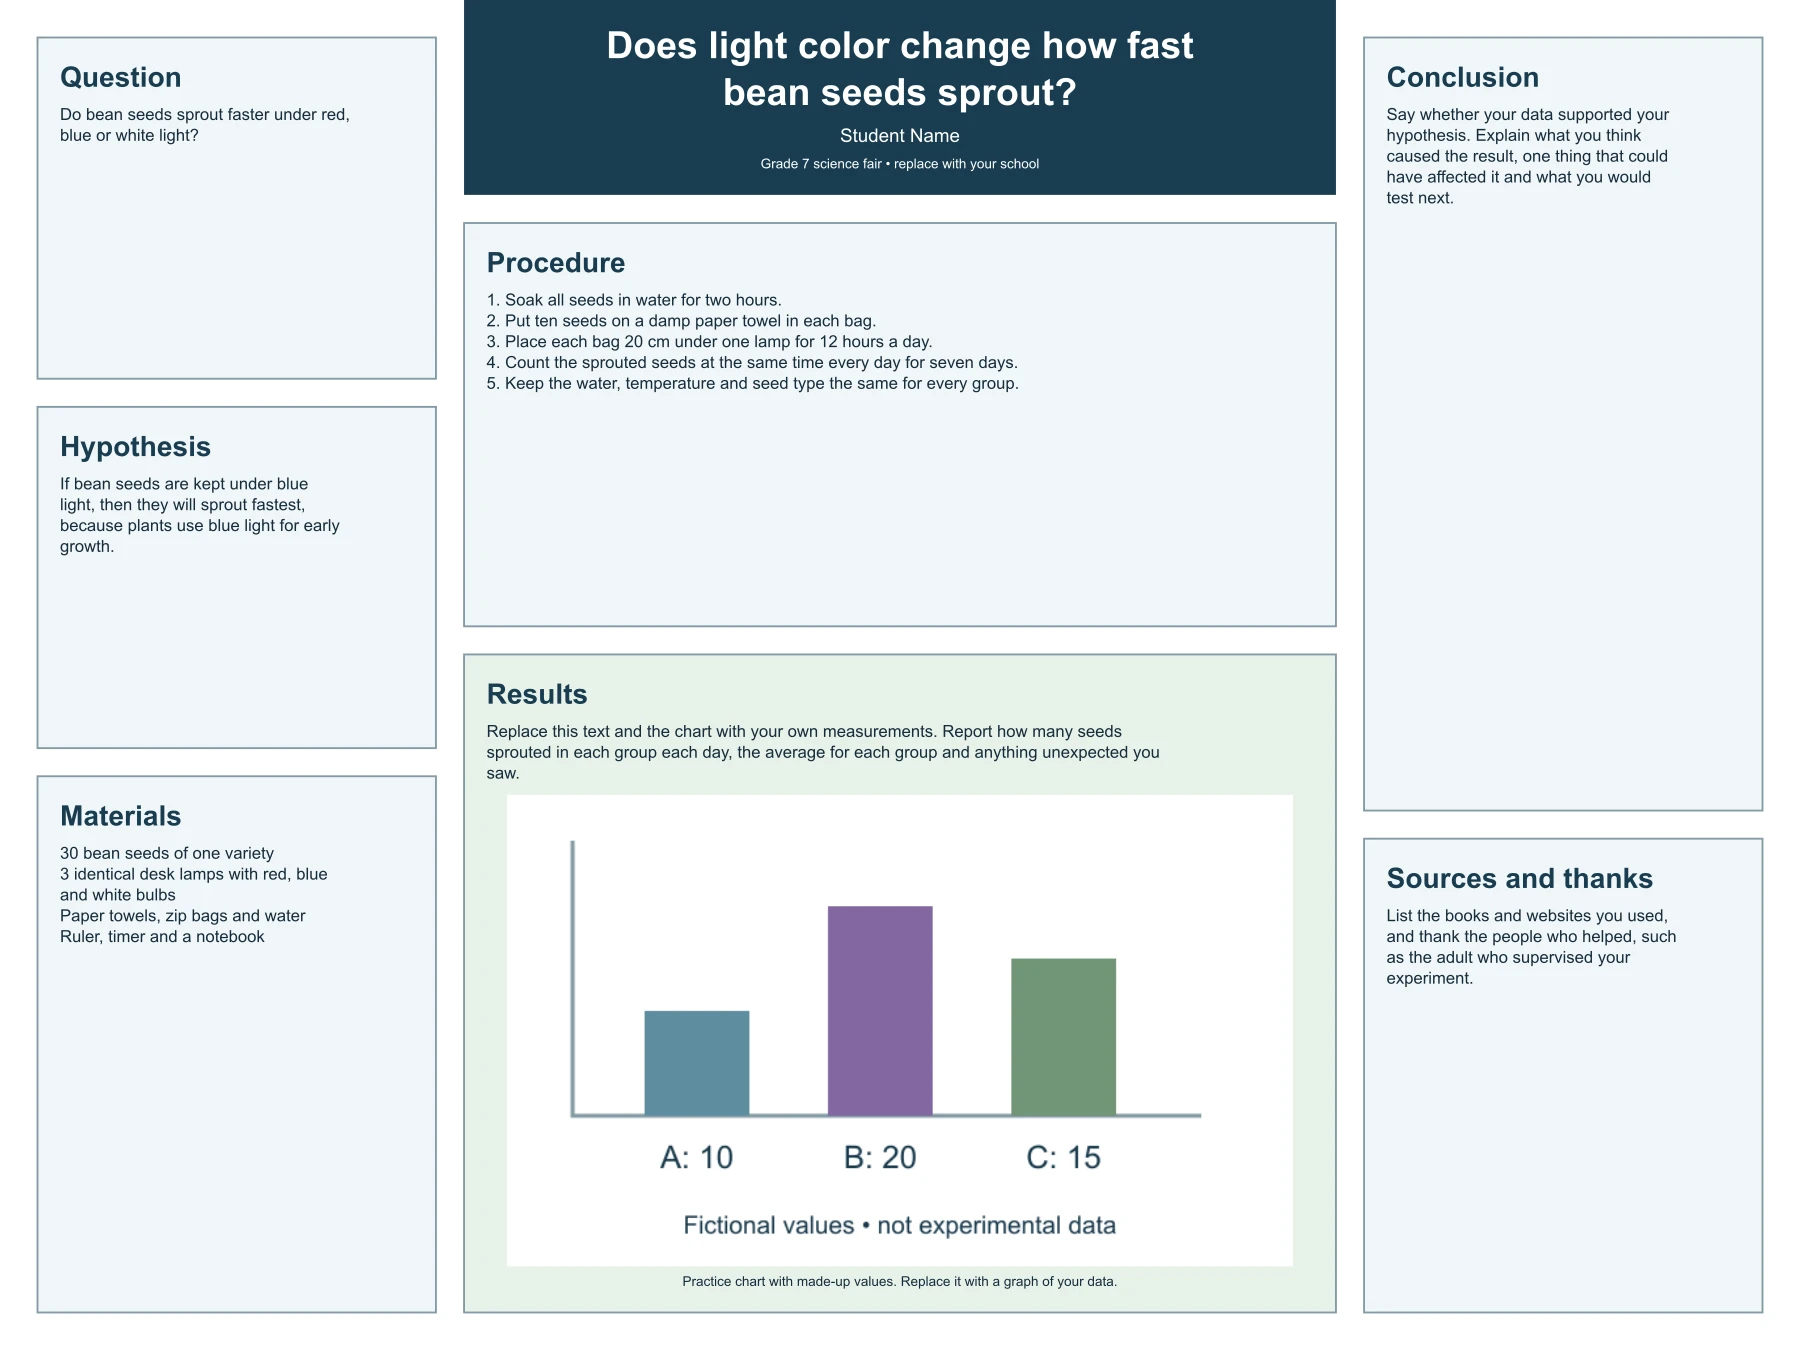
The first example asks whether bean seeds sprout faster under red, blue or white light. It shows how to word a testable question, an if-then-because hypothesis, a materials list with amounts and a numbered procedure that keeps everything the same except the light color. The question sits at the top of the left panel because judges usually start there.
The Results box deliberately does not contain invented numbers. Its text tells you what to report, and the small bar chart is labeled as practice values. Replace both with your own measurements before the fair. A results section with made-up data is worse than an honest note that the experiment is still running.
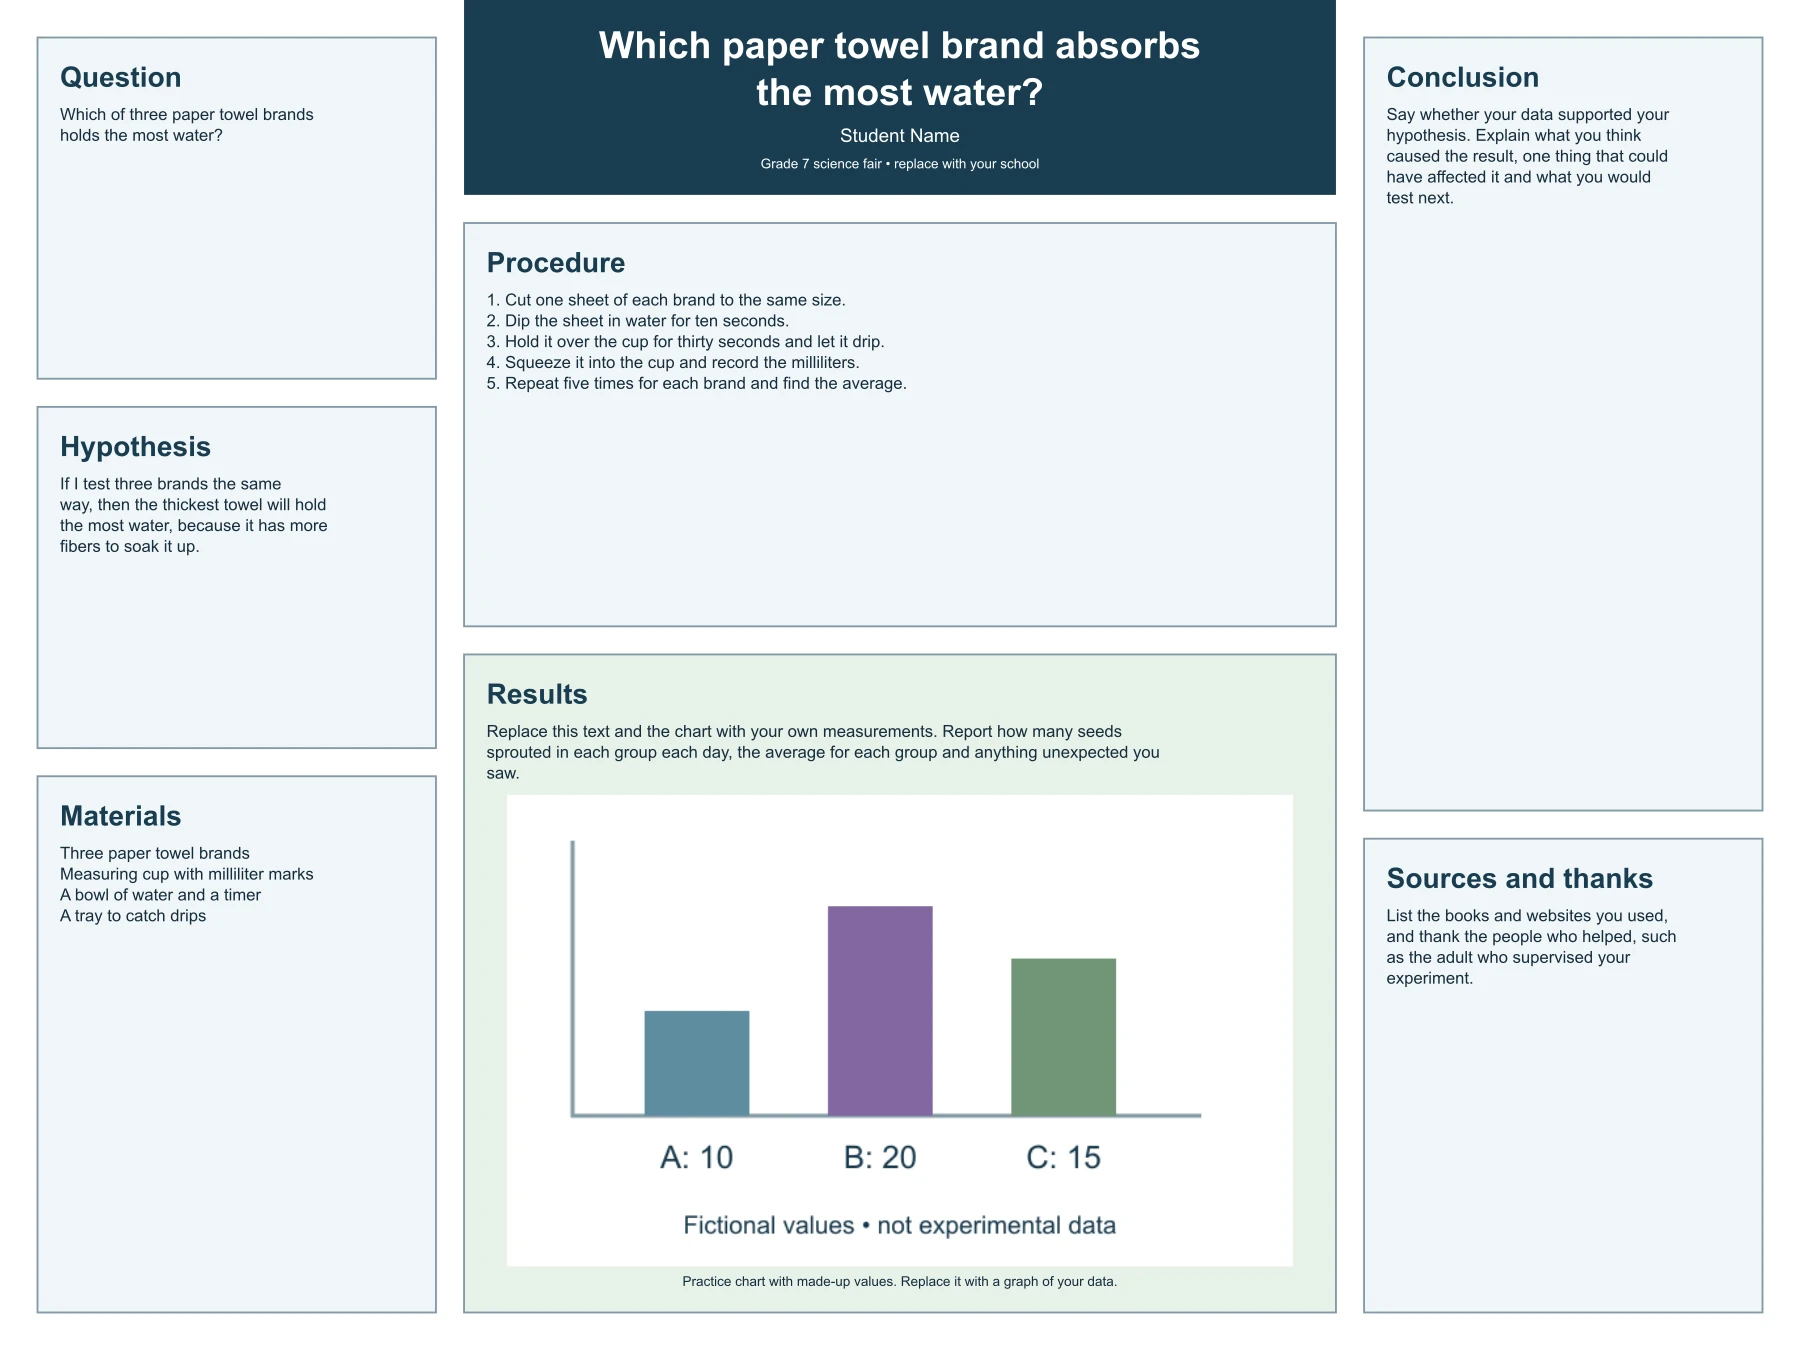
Example: a paper towel absorbency test
The second example compares how much water three paper towel brands hold. It is a classic fair project because the variable you change, the brand, is clear and the thing you measure, milliliters of water, is easy to record. The procedure repeats each test five times and averages the results, which is something judges look for.
Use this example to see how much detail a procedure needs: someone reading the board should be able to repeat the experiment without asking you. Notice that the hypothesis gives a reason, not just a guess. When you adapt it, keep the same structure and change only the content.
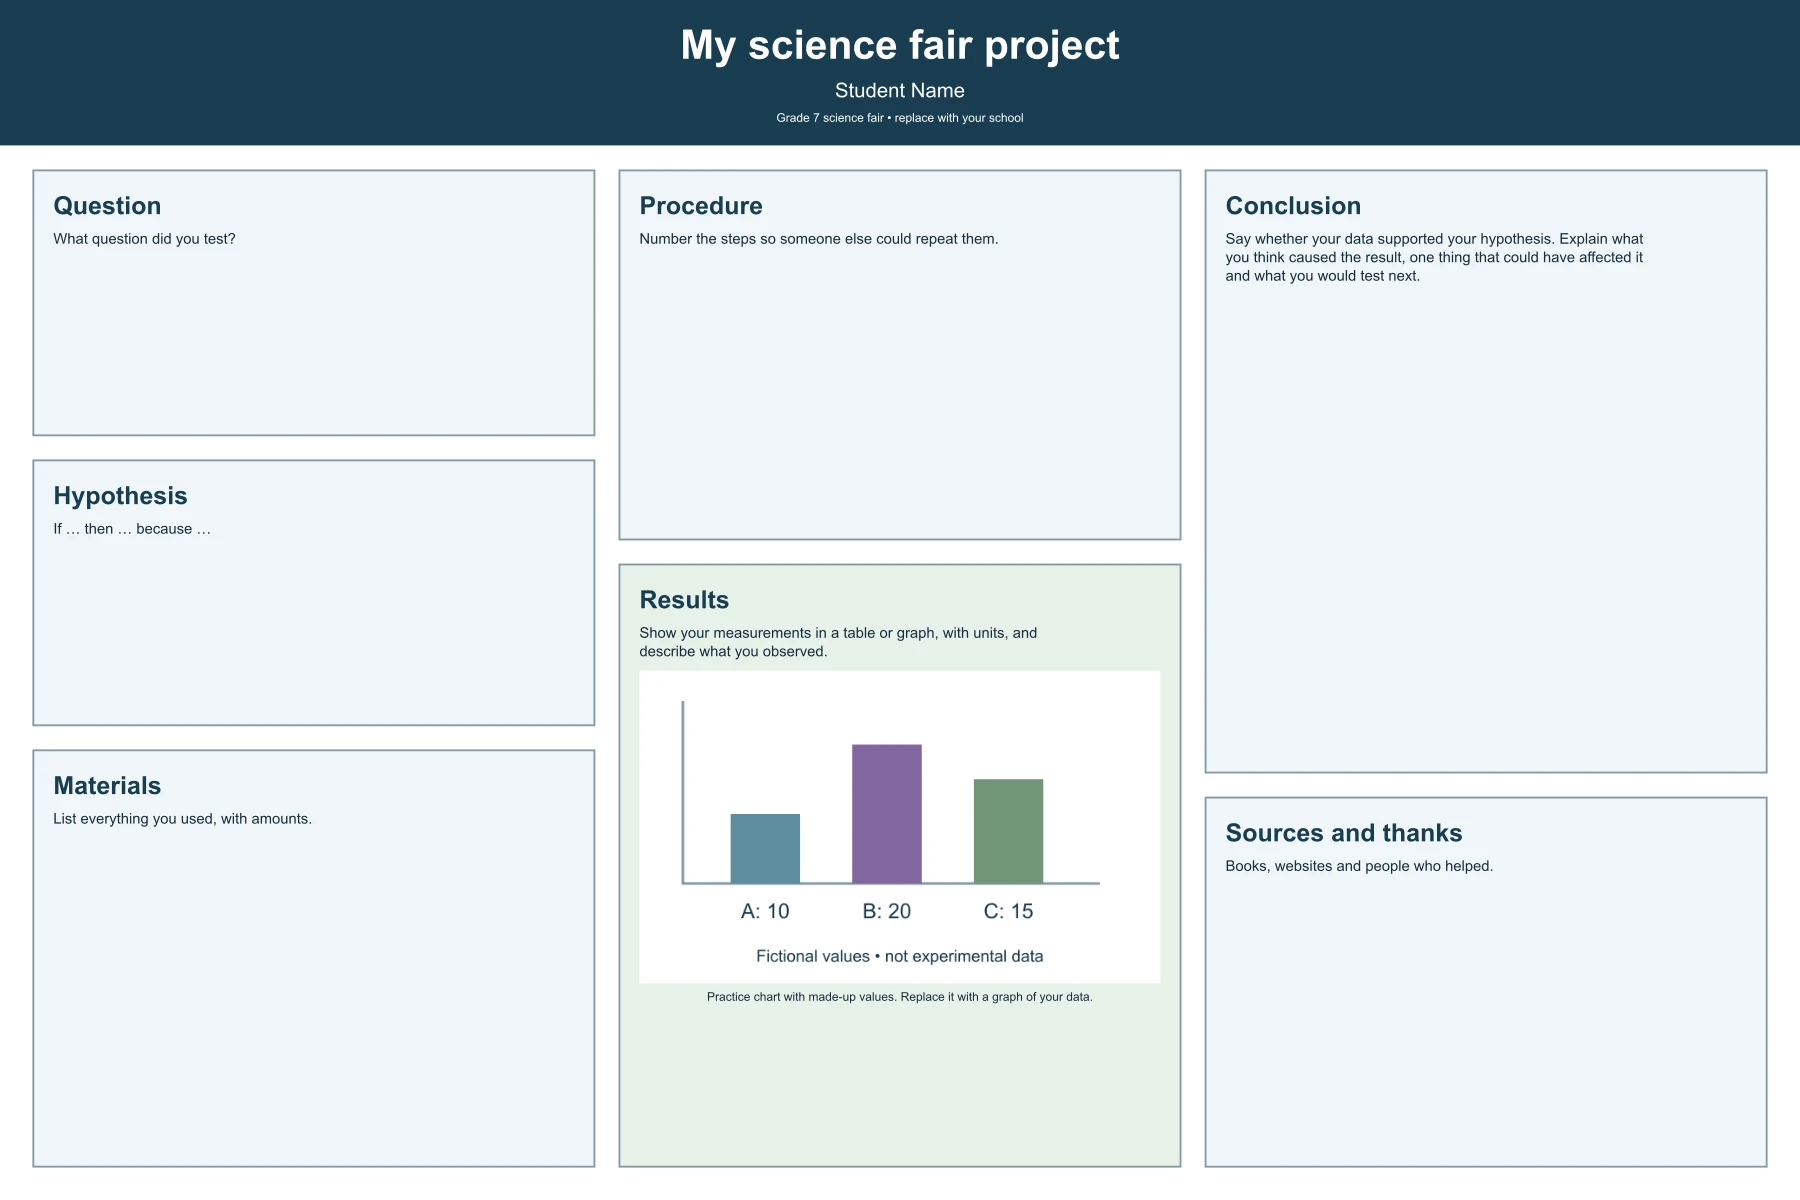
Example: a blank 36 × 24 inch flat poster
The third example uses the flat 36 × 24 inch size with short prompts in every section instead of a finished project. It is the quickest starting point when your fair or class asks for a single poster sheet rather than a standing board. The title, student name and school line are placeholders to replace.
On a flat poster the three columns are equal, so the center column is narrower than on a tri-fold board. Keep the procedure short and let the graph take most of the Results box. If you need more room, switch back to the tri-fold size or move details into your lab notebook.
What goes on a science fair board
Most fairs expect the same sections, in roughly this order: a title, the question or problem, your hypothesis, the materials, the procedure, the results with a data table or graph, and a conclusion. Many also ask for sources and acknowledgments, and some ask for an abstract. Check your fair's rules or rubric first, because some require specific headings, a research section or a log book on the table in front of the board.
Write each section for someone who walks up and has a minute. Use short sentences, put the numbers that matter in the graph and keep the background research brief. Your lab notebook can hold the full details. The template uses large type, 32 points for body text and 54 points for headings on the tri-fold board, so the board stays readable from a few feet away.
Make the results easy to read
The Results box has a slot for one graph. Upload a PNG, JPEG or WebP image of a chart you made in a spreadsheet or by hand; it is placed in the box as a picture and stays on your device. Use a bar chart to compare groups and a line graph to show change over time. Label both axes, include units and give the graph a short caption.
Describe what you observed in a sentence or two above the graph, and save the explanation for the conclusion. If something went wrong, such as a seed that never sprouted or a test you had to repeat, say so. Judges value honest observations more than perfect-looking results.
Print it or build it by hand
For a printed board, download the PowerPoint file, check the fonts and export a PDF at 48 × 36 inches for a print shop, or print each section on letter paper and glue it onto the board. The SVG is sized in inches and scales without losing quality. The PNG is a screen preview at 96 pixels per inch; it is not sharp enough to print at full board size.
If you build the board by hand, use the downloaded layout as a map: it shows where each section goes and how much space it gets. Print the sections on separate sheets, trim them and mount them on colored paper before gluing. Leave room at the top center for a large title.
Questions about the science fair poster template
Is this science fair poster template free?
Yes. Editing and the PowerPoint, SVG and PNG downloads are free and need no account or credits.
What size is a tri-fold science fair board?
A standard tri-fold board is 48 × 36 inches when open, with two 12-inch side panels and a 24-inch center panel. This template uses that size and keeps every section off the folds.
Can I edit it in PowerPoint or Google Slides?
The download is a native PowerPoint file with editable text. PowerPoint and Keynote open it directly; Google Slides can import a .pptx file, though very large slide sizes may need checking after import.
Does it include real results?
No. The examples show how to word each section, but the chart uses practice values. Replace the results text and graph with your own data before the fair.