Draw the architecture you actually mean
This neural network diagram generator draws a small, fully connected network, a multilayer perceptron, directly from the layer sizes you enter. It is useful when you need a clear architecture sketch for a methods section, a lecture slide, a project proposal or a discussion with collaborators. The displayed nodes and connections are determined by your input. There is no image model deciding how many circles look attractive. Each node in one layer connects to every node in the next layer, and there are no connections that skip layers.
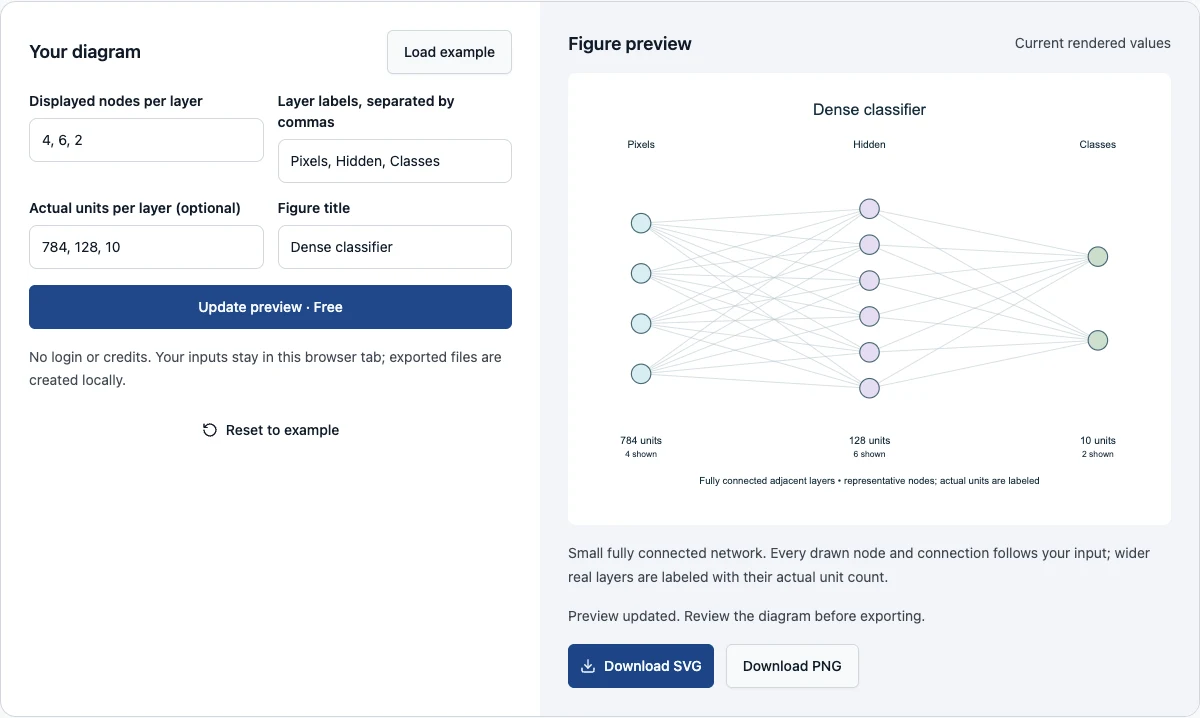
Start with the example, then edit the displayed node counts and the corresponding layer names. Use commas between both lists. A network with three layers needs three labels, in the same order. Update the preview after changing a field; the download buttons remain disabled while the visible diagram is out of date. Once the rendered diagram matches your intended schematic, download SVG for editing or PNG for a convenient raster copy. All of this happens locally, without signing in or spending credits.
Examples you can inspect
Compare the supplied input, saved result and review points before preparing your own figure.
Example: a small dense classifier
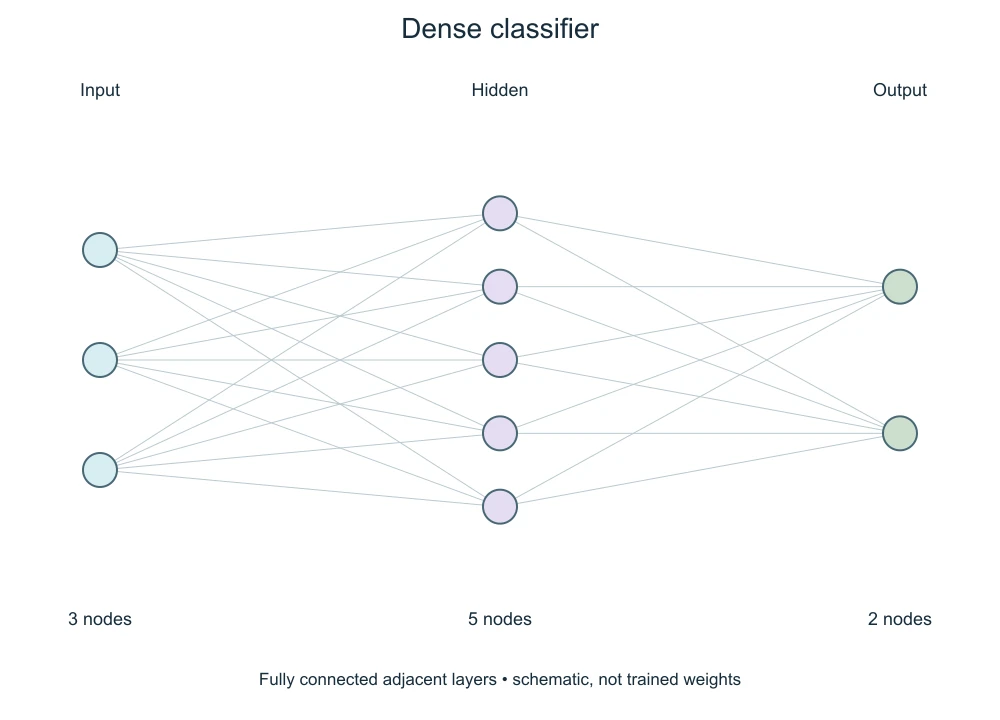
The first example uses three input nodes, five hidden nodes and two output nodes. Its labels are Input, Hidden and Output. This produces fifteen connections between the first two layers and ten between the last two. Those counts come from multiplying the neighboring layer sizes. The diagram does not include biases, activation functions, training data or loss calculations. They cannot be inferred from the number of circles, so they are deliberately absent from the export.
Use this layout for a genuinely small dense network or for a schematic that you clearly identify as simplified. If your real model has hundreds of units, the example is not an exact representation of that model. Enter the real widths in the actual-units field so that the figure itself states them, and explain in the caption that the circles are representative. Before sharing, compare the exported figure with the model definition and check that two outputs really represent your chosen prediction task rather than an accidental default.
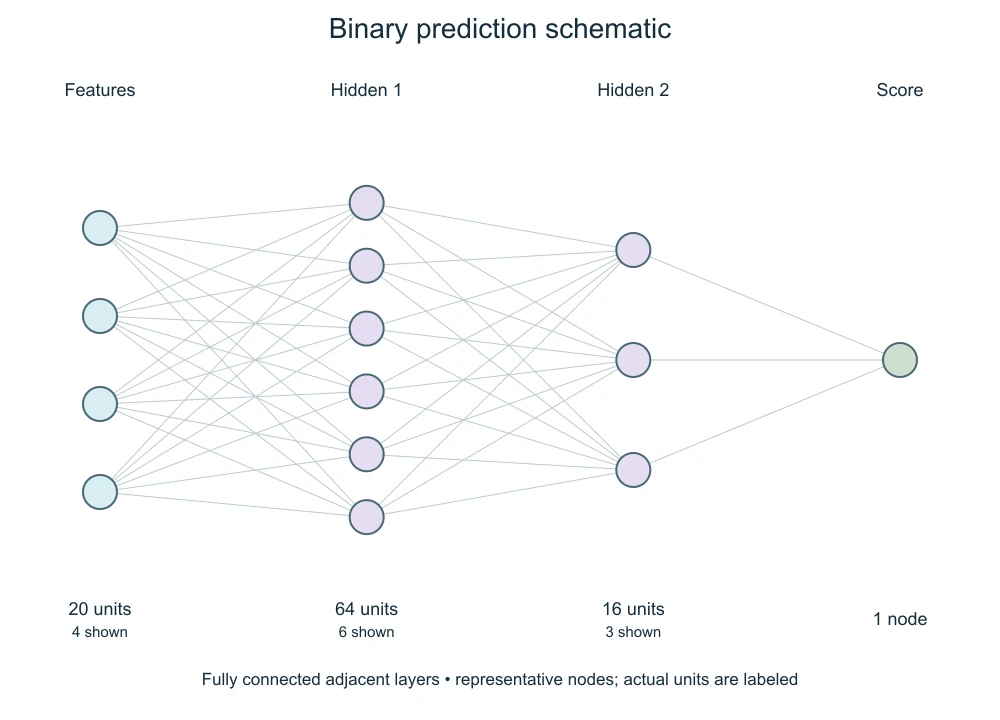
Example: a deeper binary prediction sketch
The second example draws four feature nodes, six nodes in the first hidden layer, three in the second and one output score, while the optional actual-units field records the real model: twenty features, sixty-four and sixteen hidden units and one output. Each reduced layer is captioned with its actual width and the number of nodes shown, and the footer says that the nodes are representative. The labels Features, Hidden 1, Hidden 2 and Score make the roles explicit without implying a specific activation function. The single output node does not tell a reader whether you apply a sigmoid, a threshold or another transformation.
Try this example when discussing a compact binary classifier. You can enter its values yourself and update the preview, or inspect the saved export below. Check all four layers rather than counting only the input and output. If the research compares models with different depths, keep the same terminology and caption conventions across figures. A change in the number of drawn nodes should reflect a documented architectural change or an explicitly labeled simplification, not an aesthetic preference.
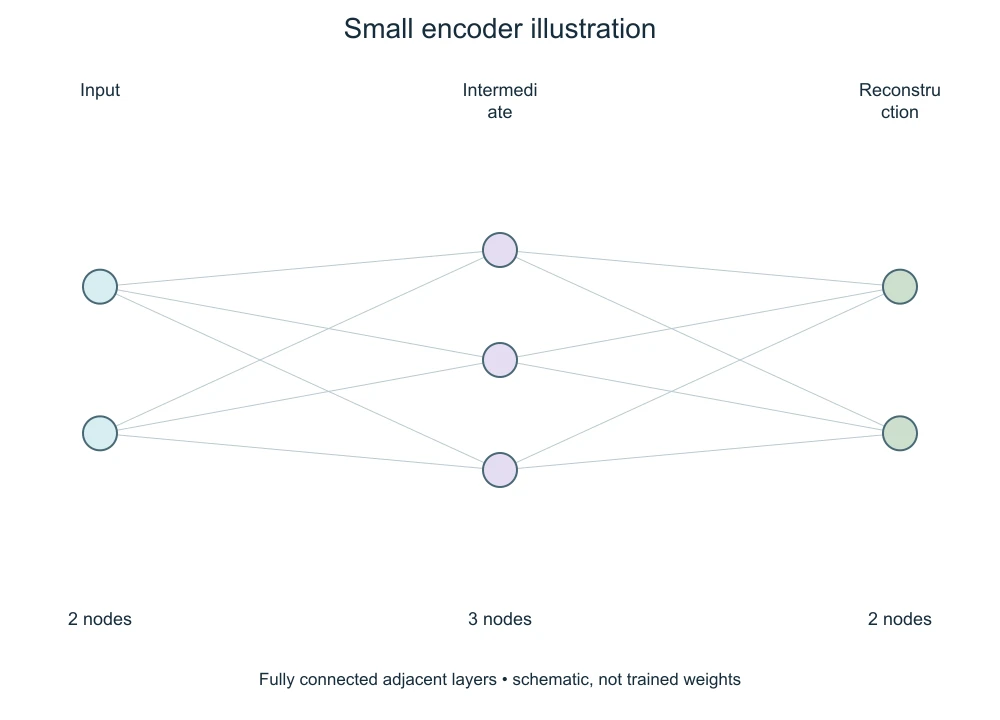
Example: an encoder-style teaching diagram
The third example uses two input nodes, three intermediate nodes and two reconstruction nodes. It illustrates a possible reading order for an encoder and reconstruction discussion, but the intermediate layer is not a compression bottleneck because it contains more displayed nodes than the input. This is an intentional teaching distinction: a convenient label such as Bottleneck does not prove that compression occurs. The saved diagram preserves the supplied label so that you can see why caption review matters.
For a true low-dimensional bottleneck illustration, change the intermediate count to one and rename the stages to match your architecture. Update the preview and compare the two versions. The input and reconstruction dimensions can match while the intermediate dimension changes. Nothing in this tool trains an autoencoder or verifies reconstruction quality. Its contribution is an inspectable drawing whose displayed topology follows the numbers you enter, making a misleading dimension choice visible before it reaches a manuscript.
Prepare layer counts and labels
Describe one feed-forward path at a time. The input accepts two to eight layers, with one to twelve displayed nodes in each. These limits keep the exported figure readable and bound the number of connections, which otherwise grows quickly. Spaces around commas are allowed. Empty layers, fractional counts, negative numbers and extra commas are rejected. Layer labels must be nonempty, match the number of layers and fit within thirty characters each.
Separate model dimensions from drawing dimensions. A diagram showing five circles might mean five real units or five representative ones, and a reader should not have to guess. When you draw fewer nodes than the layer has, enter the real widths in the optional actual-units field: one whole number per layer, none smaller than the nodes drawn. The figure then labels each reduced layer with both numbers. Leave the field empty when the circles are the real units. The generator cannot check the numbers against your code, so declaring them correctly remains the author's responsibility.
Understand what the connections represent
The connection pattern is fully connected between adjacent layers. A line represents the existence of a connection in the drawn schematic. It does not encode a learned weight, gradient, attention coefficient, confidence score or biological interaction. Line thickness and color are constant. Layer colors help distinguish position in the network; they are not a heatmap of activations. The tool also does not display the direction with individual arrowheads, which would make a dense small figure harder to read.
This makes the editor suitable for a simple multilayer perceptron schematic. It is not an exact drawing tool for convolutional kernels, residual branches, recurrent loops, transformers, graph neural networks or skip connections. Those architectures need different spatial relationships and annotations. Do not use a dense-network image merely because the broader term neural network appears in your project. If you need a conceptual illustration of a more complex system, use the existing figure workspace and label its output as a draft requiring topology review.
Make a diagram readable at publication size
Inspect the figure at the width at which it will appear in your paper or slides. A diagram that looks comfortable in a large browser preview can become a dense mesh after reduction to a single column. Shorten labels before shrinking the whole image. If the connection bundles dominate, reduce the displayed units only when you can clearly disclose that simplification. Keep actual dimension numbers available in the caption or accompanying table.
The SVG output has a white background, consistent strokes and live text. These choices provide a predictable starting point, rather than a promise about every publisher's formatting rules. Check the journal's own requirements for font size, color and supported file types. You can open the SVG in a compatible vector editor to add activation names or other annotations. Once you add those elements, verify that they still agree with the code and do not overlap the original nodes.
Choose SVG or PNG deliberately
SVG retains the drawn circles, lines and labels as separate vector elements. It can be scaled without turning the geometry into pixels and is the better choice when you expect to edit the layout elsewhere. The file is a regular image document; it is not a model configuration, a training checkpoint or executable network code. Font rendering can differ across applications, so reopen the downloaded file in the software that will receive your final figure.
PNG is rendered from the same SVG at its native export dimensions. It is convenient for presentations, email and applications that do not accept SVG, but its text and shapes are flattened into pixels. Increasing its display size does not add detail. If a journal requests a large raster image, retain the SVG as your master and export at an appropriate size in a compatible editor. The PNG button here does not offer arbitrary print dimensions or resolution metadata settings.
Review the figure with your model definition
Use a short verification pass before publication: check layer order, count the displayed nodes, inspect labels and confirm that every line joins neighboring layers only. Compare the architecture title with the task the model performs. Then read the figure caption as if you had never seen the code. It should explain inputs, outputs and any schematic reduction without requiring a reader to infer missing details from the colors.
Saved examples are fictional teaching architectures. They contain no measured accuracy and no evidence that a network is appropriate for a dataset. Your own diagram can document a design, but it does not validate that design or show successful training. Keep evaluation results in their appropriate plots and tables. A clear architecture figure complements those results by making the computation understandable, while preserving the distinction between the intended structure and the observed performance.
Questions about network sketches
Can I draw a very wide hidden layer?
You can display up to twelve nodes per layer. For a wider real layer, draw representative nodes and enter the real width in the actual-units field so the figure labels both numbers, or use a specialist architecture editor when every unit must appear.
Can I edit the export?
The SVG contains editable text and shapes in compatible software. The PNG is a raster image. Neither export creates a trainable model or imports a framework's architecture file.
Are drafts sent to an AI service?
This editor computes its geometry in your browser. It does not submit a generation task, require login or consume credits. Text inputs may be retained in this browser tab for restoration; clearing the tab's storage removes that local draft.
Why did the preview not change as I typed?
Updates are explicit so that you can finish a valid input before redrawing. The page marks changed inputs, retains the previous good preview and disables export until the new values render successfully. Correct the highlighted input problem and choose Update preview again.