Three ways to fill a three-circle Venn diagram
This three-circle Venn diagram maker accepts whichever form your comparison already has. Choose seven region counts when the overlaps are already tallied, text for each region when you want words or short member lists inside the circles, or three lists when you have raw members and need the overlaps found for you. All three modes draw the same three circles with editable set labels and export SVG or PNG. The circles always use the same schematic geometry: a larger number does not create a larger circle or overlap, and the page states that limitation beside the output.
Each mode keeps its own inputs, so switching from counts to lists and back does not erase what you typed. Change the set labels, open the fields for the selected mode and update the preview. Counts must be nonnegative whole numbers, region text must fit inside its region, and list members are compared by the stated matching rules. The editor rejects an input it cannot draw faithfully instead of clipping it. Everything runs in your browser without an account or credits.
Examples you can inspect
Compare the supplied input, saved result and review points before preparing your own figure.
Example: counts from two screens and a literature list
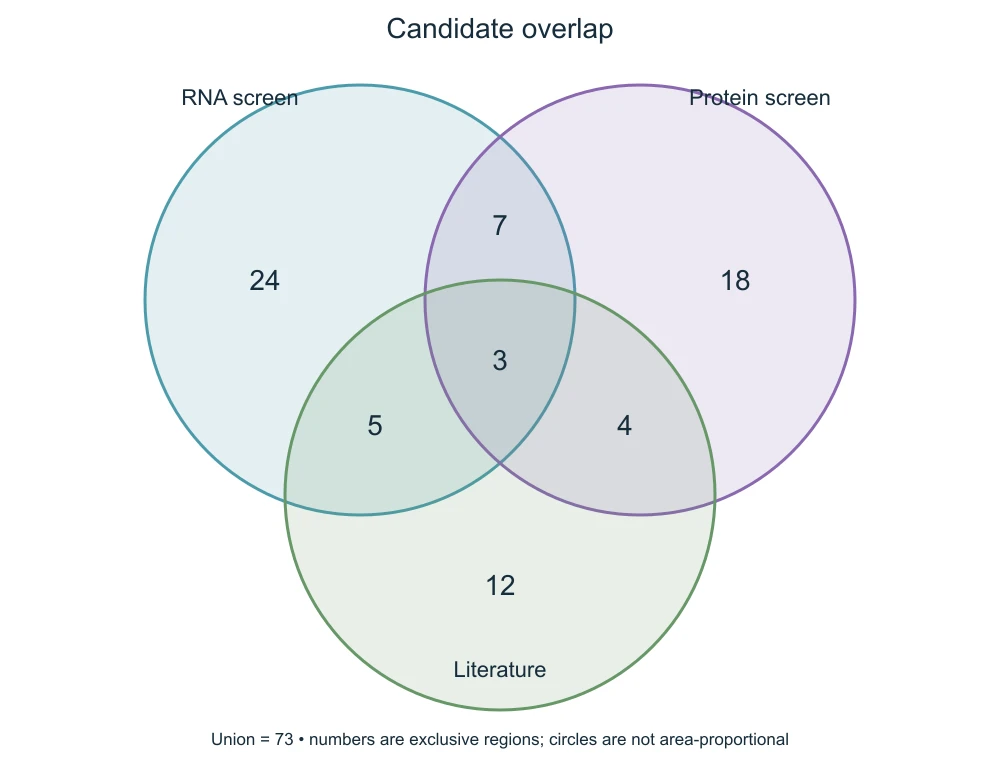
The first example compares an RNA screen, a protein screen and a literature list. There are twenty-four candidates in RNA only, eighteen in protein only and twelve in literature only. Seven appear in RNA and protein but not literature; five appear in RNA and literature but not protein; four appear in protein and literature but not RNA. Three appear in all three. These seven regions sum to seventy-three unique candidates in the union.
The distinction between exclusive and inclusive overlaps is central. The inclusive RNA-and-protein intersection contains ten candidates, because it includes both the seven in that pair-only region and the three shared by all sets. Entering ten into the pair-only field would double-count the center. Inspect the three pair fields before accepting the total. This example demonstrates counting conventions, not a biological conclusion or evidence that the shared candidates are necessarily the most useful ones.
Example: text inside every region
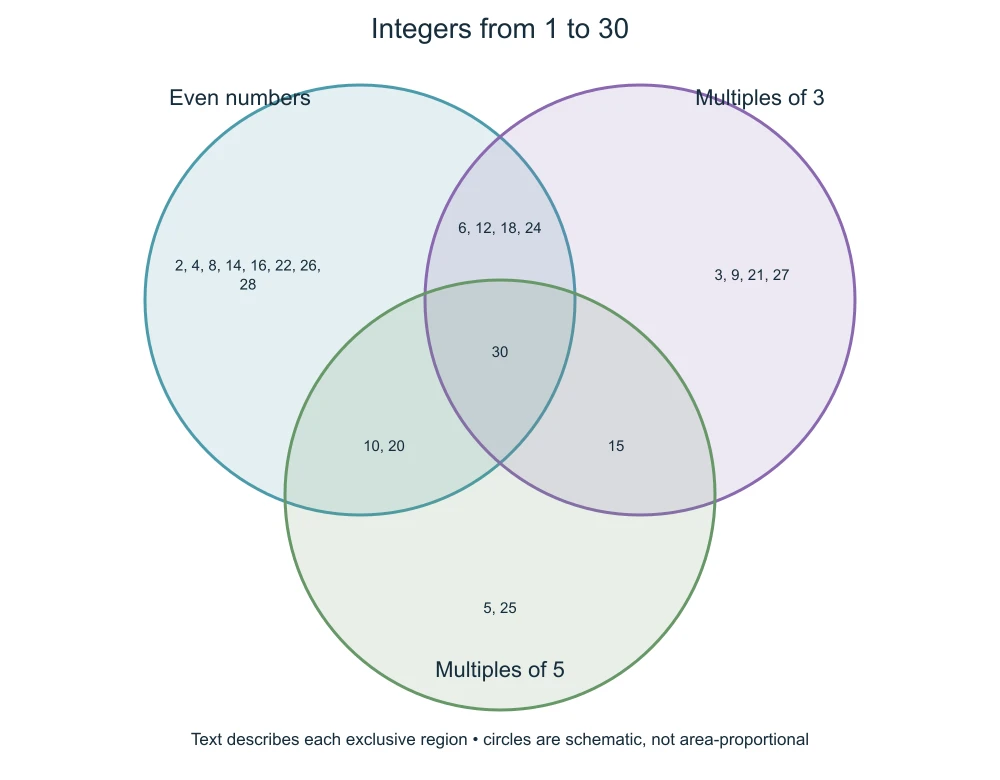
The second example switches to region text and sorts the integers from one to thirty by three properties: even numbers, multiples of three and multiples of five. Thirty is the only number with all three properties, so it sits in the center. Six, twelve, eighteen and twenty-four are even multiples of three that are not multiples of five. Ten and twenty share the even and five circles, fifteen shares the three and five circles, and the remaining members appear in the three outer regions. Every placement can be checked by hand, which is the point of a teaching example.
Use this mode for a conceptual comparison or a short member list, where words matter more than totals. The pair regions and the center are narrow, so they hold a short phrase or a few members; the outer regions hold more. When a phrase does not fit, the editor names the region and keeps the previous preview instead of shrinking the type until it is unreadable. An empty text field leaves that region blank, which is different from stating that the region has no members.
Example: three pasted lists with automatic overlaps
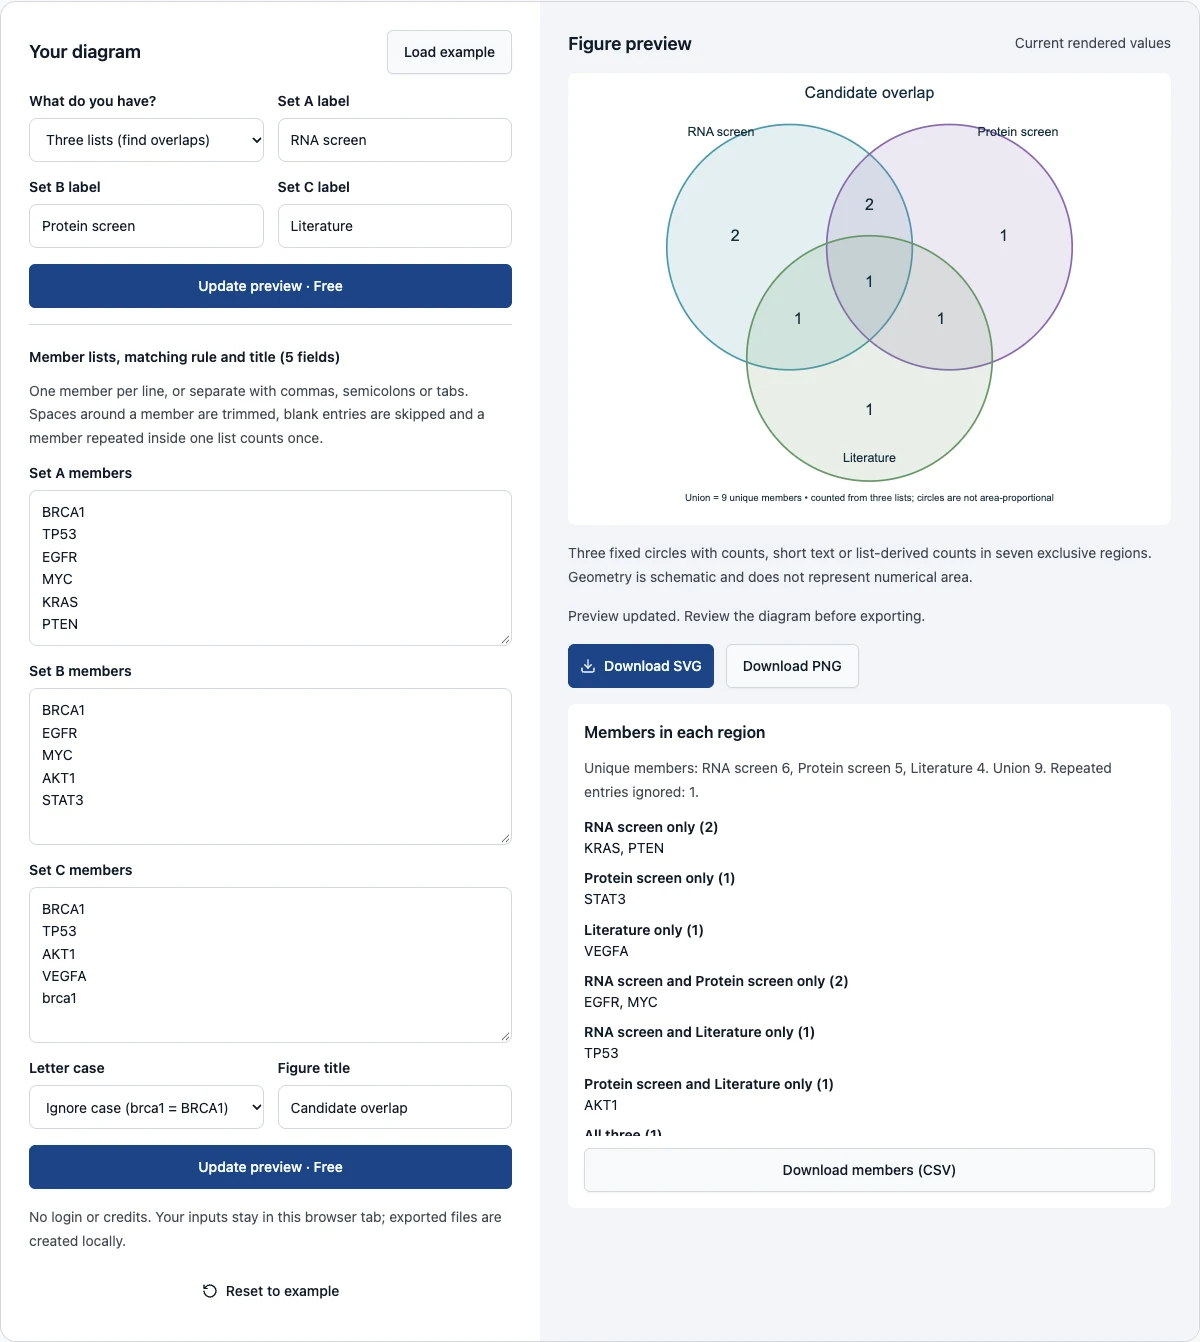
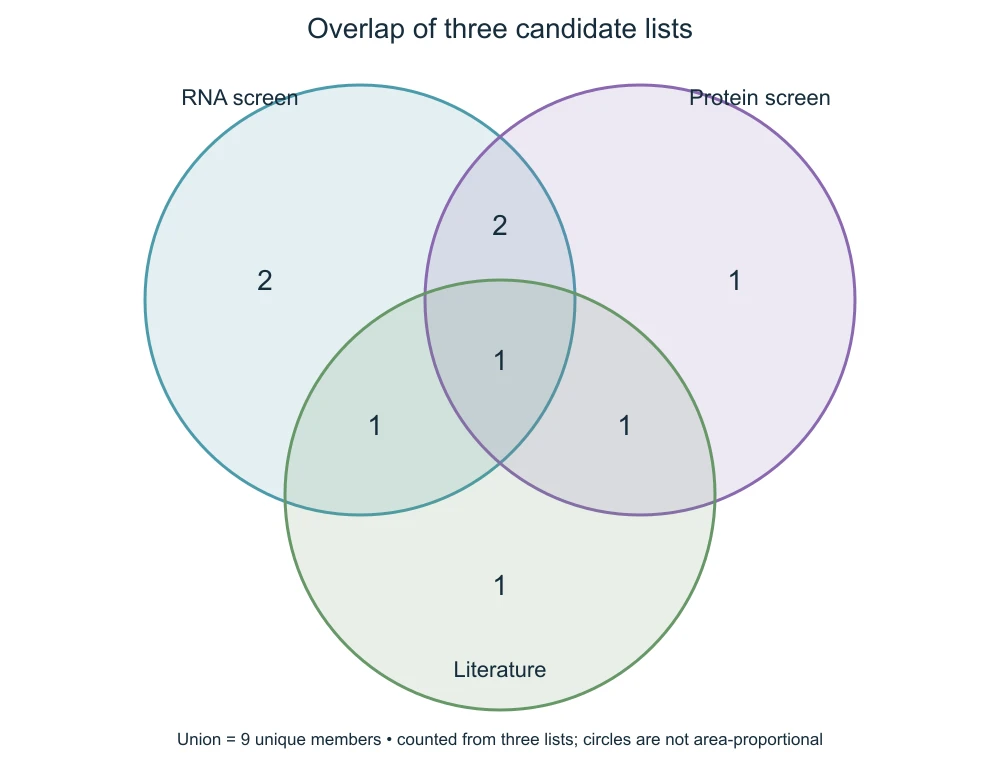
The third example pastes three short fictional candidate lists of gene symbols. The RNA list has six members and the protein list five. The literature list contains BRCA1 twice, once in lower case; with the default rule, case is ignored and the repeated entry counts once, leaving four unique members. The tool reports BRCA1 in all three lists, EGFR and MYC in RNA and protein only, TP53 in RNA and literature only, AKT1 in protein and literature only, and KRAS, PTEN, STAT3 and VEGFA in one list each. The union is nine.
Below the preview, the page lists the members of every region and offers them as a CSV file, so the diagram and the membership table come from the same calculation. Change one member, update the preview and the affected regions change. Switch the rule to match case exactly and the lower-case entry becomes a separate member: the literature-only count rises to two and the union to ten. The symbols are a teaching list, not the result of a real screen.
Know the list matching rules
Members are separated by new lines, commas, semicolons or tabs. Spaces around a member are trimmed and blank entries are skipped. A member repeated inside one list counts once, and the page reports how many repeated entries it ignored. By default letter case is ignored, so brca1 and BRCA1 are the same member; choose exact matching when case carries meaning in your identifiers. Nothing else is normalized. A space inside a name, a version suffix or a different identifier system makes two entries different members.
That narrowness is deliberate. The tool does not map gene names to protein accessions, resolve synonyms or guess that two spellings mean the same thing. Reconcile identifiers before pasting, and record the rule you used in your methods. Each list accepts up to five thousand unique members of at most eighty characters. Lists are processed in your browser and are not uploaded.
Convert set totals into exclusive regions
In counts mode, prepare the region counts before opening the editor. If you have the member identifiers themselves, the three-lists mode performs this step for you. Do not paste entire set sizes into the A-only, B-only and C-only fields. Each whole-set total includes its exclusive region, two pair-only regions and the central three-way region. The union includes all seven, while an inclusive pair intersection includes its pair-only count plus the center.
Suppose your A-and-B intersection is ten and the three-way intersection is three. The A-and-B-only input should be seven. Perform the same subtraction for the other pairs before deriving the exclusive set counts. Check that every derived value is nonnegative. A negative exclusive region usually means incompatible summary counts, inconsistent identifiers or a misunderstanding of inclusive intersections. The tool rejects negative values rather than turning contradictory data into a visually plausible diagram.
Define the membership unit
A count is meaningful only when its unit is clear. Decide whether a member is a gene, protein, person, study, report or another entity. A gene list and a protein list may need an explicit mapping before they can be compared; equal-looking labels are not sufficient evidence that identifiers correspond. Remove duplicates within each set according to a documented rule, and normalize identifiers consistently before constructing the overlap table.
For people, distinguish unique participants from repeated responses. For literature, distinguish studies from individual reports. Combining different units can make the union mathematically correct while scientifically meaningless. The editor compares the strings you paste or draws the counts you provide; it does not reconcile identifiers across naming systems. Preserve the source lists and calculation method outside this page so that a collaborator can reproduce each region and understand exclusions or mapping decisions.
Use labels that explain the comparison
The three set labels are limited to twenty-four characters to keep them readable around the circles. Choose short names that identify the comparison, then explain detailed criteria in the caption. RNA screen is more informative than Set A when that is the actual source, but a short label alone cannot specify the experiment's threshold, sample or measurement unit. Include those details in accompanying text rather than squeezing a paragraph into the figure.
Use the same labels in the diagram, methods and supporting tables. If you compare treatment conditions, avoid names that imply a causal interpretation beyond the study design. The default title is also editable. A descriptive title such as Candidate overlap is safer than a conclusion like Confirmed mechanisms unless the data support that claim. A Venn diagram shows membership relationships; it does not by itself establish significance, agreement quality or biological importance.
Export a figure you can revise
SVG preserves the circle geometry, text and region values as editable vector elements. Open it in a compatible editor when you need a different font, added annotations or a layout matched to a journal. Recheck the numbers after manual edits, particularly when moving the central value or changing labels. The exported SVG is a drawing, not an underlying membership dataset, so retain your original region table as the source of truth.
PNG is a raster copy produced from the current SVG. It works well in slides and documents that prefer image files, but it does not retain separate editable elements. The download uses the diagram's native pixel dimensions. Resizing a PNG later may blur labels, whereas the SVG can remain the master for a new export. Neither image includes the member identifiers; in lists mode, download the CSV of region members and keep it with the figure.
Validate overlap claims before sharing
Ask a second reader to reconstruct the three set totals and the union from the seven regions. If that reader cannot tell whether pair intersections include the center, improve the caption. Check that counts are unique members and that zeros are deliberate. Compare the diagram with any overlap table in the supplementary material. A discrepancy between the picture and table should be resolved before submission, even when the picture looks balanced.
The saved examples are fictional and exist to demonstrate these checks. They are not assay results or participant data. Your own figure should state the membership unit, criteria, source and counting convention. A useful caption can explain that circles are schematic, region values are exclusive and the union represents unique members. Those details make the visualization auditable and keep an attractive figure from being mistaken for evidence of an unstated analysis.
Questions about three-circle Venn diagrams
Can I paste raw member lists?
Yes. Choose the three-lists mode, paste one list per set and update the preview. The page counts the seven regions, lists their members and offers a CSV. Document your matching rule with the figure.
Can I put words instead of numbers in the circles?
Yes. The region-text mode draws a short phrase or member list in each of the seven regions and tells you when a text does not fit.
Are the areas proportional to the counts?
No. The circle geometry is fixed. Use the printed numbers to interpret size, and state that the figure is schematic when publishing.
What happens after I change a value?
The page marks the inputs as changed and disables exports until you update the preview successfully. An invalid input leaves the previous good diagram visible. This prevents downloading a stale figure without noticing that the displayed numbers no longer match your current fields.