Describe the process before drawing the picture
This biology diagram maker is an AI drafting tool: it turns a written biological process into a labeled raster draft. It is not a drag-and-drop editor, an icon library or lab-equipment drawing software. It is intended for research communication, teaching and early figure planning when you can describe the cells, compartments, components and relationships that should appear. The input is a process brief, not an entire paper that the tool automatically parses. The image model uses that brief to propose a layout; it does not verify the biology or guarantee that every label and arrow is correct.
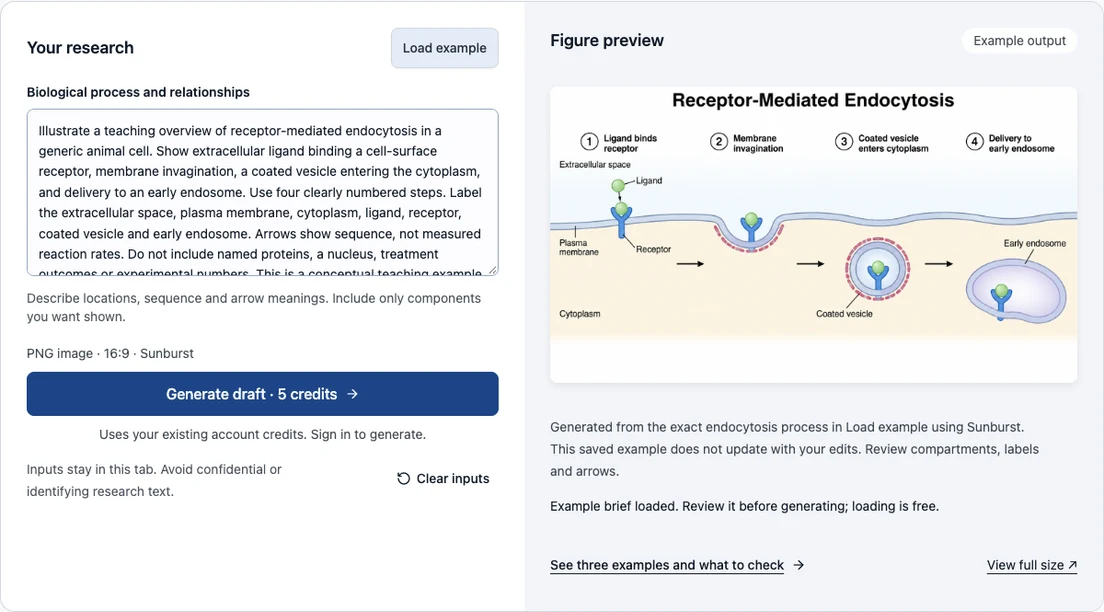
Load the endocytosis example to see a complete process description without spending credits. Loading only fills the form. Generating creates one to four separately billed image tasks through your existing account, with the displayed credit cost shown before submission. Sign in when ready; returning from login retains the draft and does not automatically generate. The preview initially shows a saved output from the exact teaching example, clearly separated from any new result produced for your own input.
Examples you can inspect
Compare the supplied input, saved result and review points before preparing your own figure.
Example: a receptor-mediated endocytosis overview
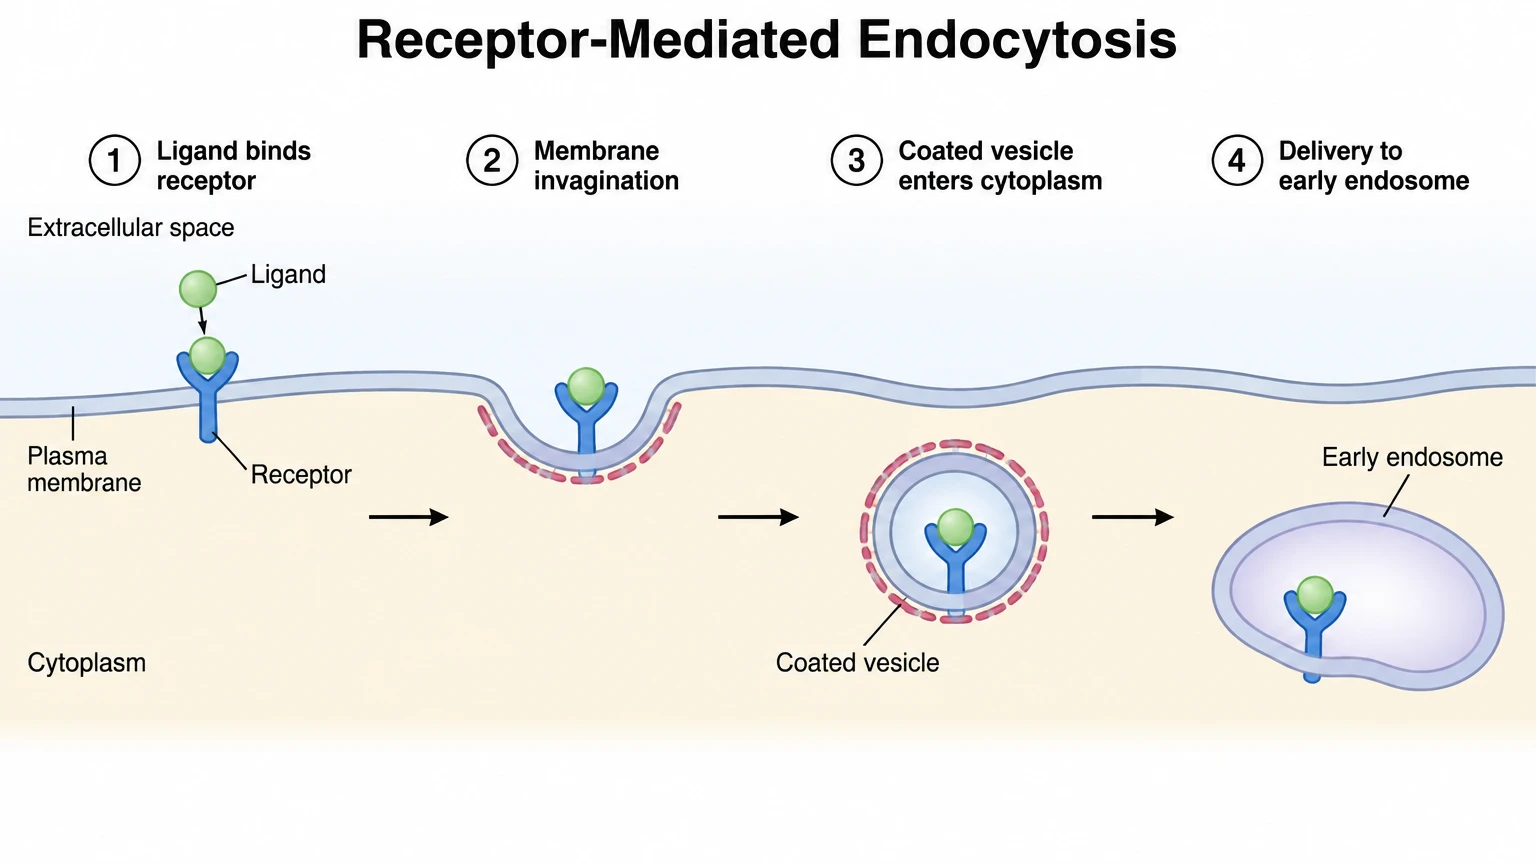
The first case is a fictional teaching overview in a generic animal cell. The source brief asks for extracellular ligand binding to a surface receptor, membrane invagination, a coated vesicle entering the cytoplasm and delivery to an early endosome. It specifies four numbered stages and names the compartments and structures that should be labeled. It explicitly excludes named proteins, a nucleus, treatment outcomes and numerical results.
The displayed image is an actual output from the Sunburst provider helper with the default settings offered by this tool. It is not a manually perfected scientific diagram. Check the four stages, the boundary between extracellular space and cytoplasm, and whether ligand and receptor remain distinguishable across the sequence. Review all labels and arrows at full size. The vesicle and endosome drawings place the receptor tail near or across the compartment boundary, so membrane topology needs correction or specialist review before scientific use. The image illustrates an intended process, but its appearance alone does not establish the accuracy of the compartment geometry or molecular interactions.
Example: reviewing a vascular mechanism illustration
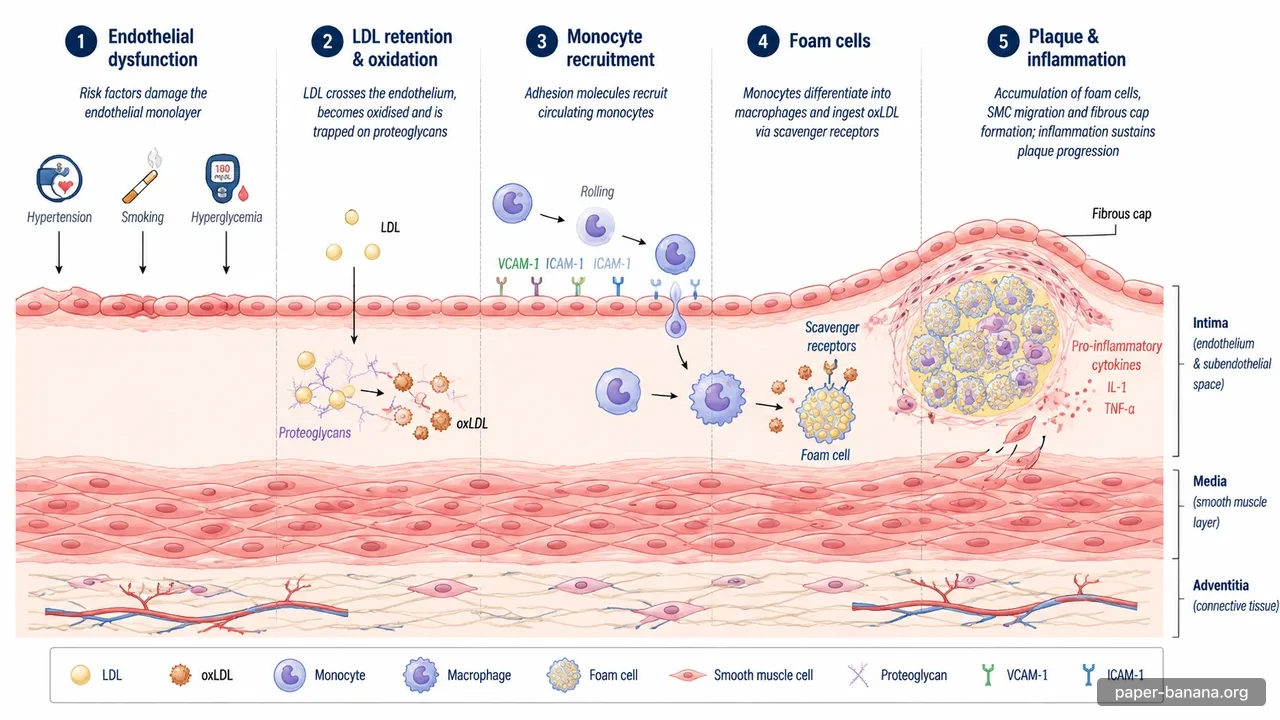
The second case uses an existing catalog illustration of an atherosclerosis mechanism. It organizes several stages around an artery cross-section, including endothelial dysfunction, lipid retention, monocyte recruitment and foam-cell formation. This is catalog material with an unverified original model and rendering date, not an output generated from a new brief on this page. Its suggested input is a way to discuss the diagram's structure, not a claim about the original prompt.
The case demonstrates why a biology figure maker needs scientific review. Some labels in the catalog image are malformed or duplicated, and its anatomical details and arrow meanings require verification. Use it as a review exercise rather than as validated medical evidence. For your own study, describe only the mechanism and experimental conditions you actually investigated. A broad disease overview should not become an unsupported claim that your intervention changes every stage of that process.
Example: checking a mitophagy cycle illustration
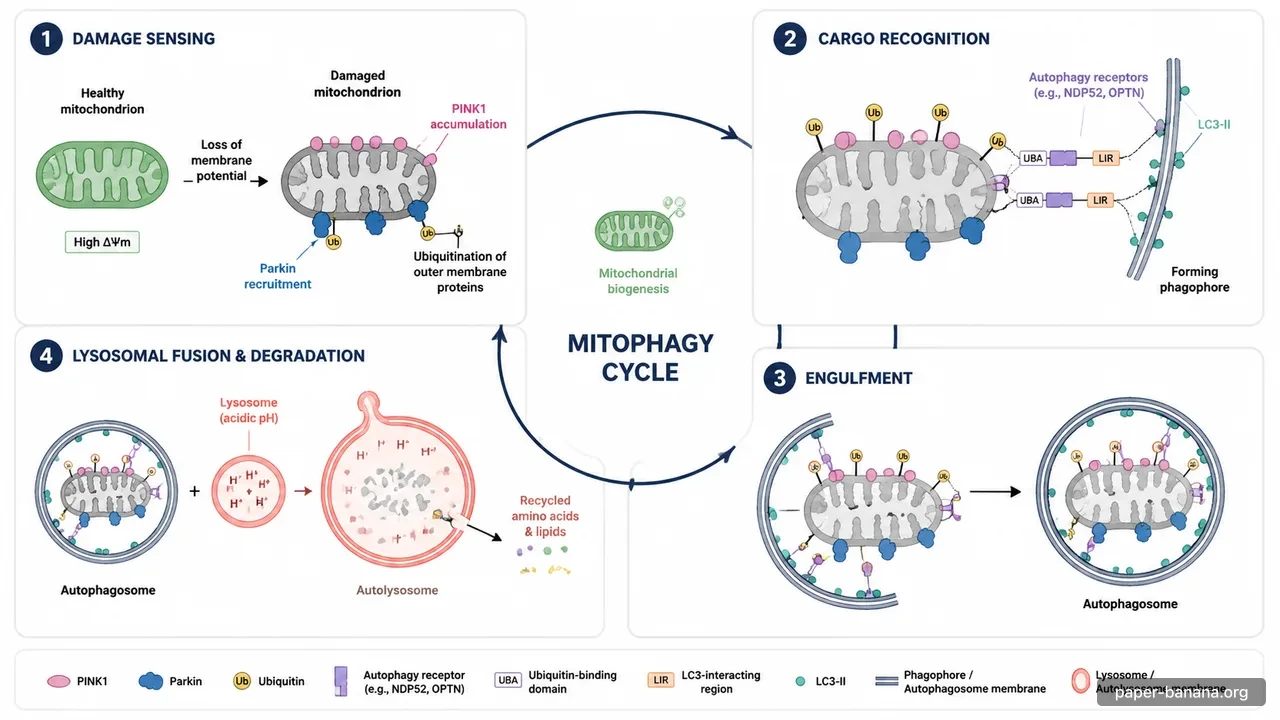
The third case uses an existing catalog illustration of a mitophagy cycle, with separate panels for damage sensing, cargo recognition, engulfment and degradation. It is a different biological task from receptor-mediated endocytosis. This catalog image's original rendering date and model are unverified, and it is not represented as a newly generated result from this page. A suggested brief would name the intended organelles, compartments, stages and arrow meanings, then state which molecular detail belongs in the overview.
The catalog illustration contains detailed protein and domain labels, which require specialist verification rather than acceptance because the image looks polished. Its circular connection back toward mitochondrial biogenesis should also be checked: a recycling flow must not be read as evidence that the diagram establishes a measured mechanism or a specific rate. Verify membrane identities, label attachment and the distinction between conceptual overview and experimental finding. Use this case to decide whether your own brief needs a narrow workflow or a more detailed, separately reviewed pathway.
Prepare a bounded biological brief
Begin with the cell type or biological system and the process you want to communicate. Name the essential components and the compartment in which each belongs. Then describe the relationships in a sensible order, including any directionality that matters. Specify what should not appear when a common background element could mislead readers. The teaching example excludes a nucleus because it is unnecessary to the chosen process, not because all biological diagrams should omit one.
Use supported terminology and keep the scope small enough to inspect. A long list of every possible pathway component can produce a busy image without making the argument clearer. The input accepts up to twelve thousand characters, but concise, complete facts are more useful than filling the limit. This page does not retrieve a paper, identify missing methods or choose the biologically correct mechanism from an ambiguous description. Resolve those questions in your research workflow before generating a figure.
Separate observed results from established background
State which relationships are background knowledge and which are findings from your study. If you request numerical observations, include their values, units and conditions directly. Do not ask the model to fill a results panel with a typical improvement or an expected effect. The request instructs it to avoid invented components and experimental claims, but that instruction is not a guarantee that the generated image will contain no errors.
For a conceptual teaching figure, say that no measured result is intended. For an experimental figure, keep the intervention, comparison and observation tied together. A visual layout can make an association appear causal through proximity or arrows, so review the draft against the actual study design. An attractive biological diagram should help a reader understand the evidence while preserving the difference between a known process, a proposed explanation and a measured result.
Make compartments and labels inspectable
Location often carries scientific meaning. Distinguish extracellular space from cytoplasm, organelle boundaries from surrounding fluid and membrane-associated structures from soluble components. State these relationships in the input instead of hoping that a familiar icon will communicate them. The generated draft may still use an inconsistent boundary or put a label close to the wrong structure. Inspect the raster at full size and compare each location with the brief.
Short labels are easier to read and check than sentences embedded in the image. Use the figure caption for long explanations. Verify spelling, capitalization and any abbreviations before publication. Raster text is not separately editable in this tool, so correcting a label may require another generation or editing through an appropriate existing workflow. Do not assume that a small label is correct simply because the overall composition is convincing.
Review the image as a scientific draft
Check component identity, number, location, connectivity and direction. Compare the requested stages with the rendered ones, and look for extra structures that the source did not specify. Verify whether the visual style creates unintended claims, such as a uniform cell size being mistaken for a measurement. Ask a knowledgeable collaborator to examine a figure that will represent scientific results. The tool's teaching examples are communication exercises, not domain approval.
The saved output may contain text or geometry defects even when the main sequence is recognizable. Those limits remain relevant to new generations, which can differ from the example. The tool does not return a validated molecular pathway, a medical interpretation or a quantitatively accurate spatial model. Use the generated image as a reviewable draft, and retain the original brief so that corrections can be made against a clear specification rather than subjective appearance alone.
Understand costs and interrupted tasks
The generate button shows the total cost for the selected quality and image count before you submit. It uses the existing account's credits and trial entitlements, not a separate free allocation for this page. Loading a brief and inspecting saved examples are free. Signing in does not automatically spend credits. If you intentionally generate a new version, it is another task and may consume another displayed charge under the existing rules.
The interface prevents a second submission while a task is pending and does not automatically resend a paid request after a lost response. If a task identifier is available, resume checking that same task. If the response is uncertain, check task history and your balance before enabling another generation. These safeguards reduce accidental repeat actions; they do not establish exactly-once billing for a service without an idempotency key. The saved provider example demonstrates output capability, not a test of a real account's debit or refund records.
Choose the right output workflow
The default is one landscape PNG draft with English labels. Choose Sunburst or GPT Image 2, aspect ratio, Default or HD quality, PNG/JPG/WebP, one to four images and label language. Auto follows the source description. Each image is a separate task; changing settings does not alter the saved example. The downloaded result is a raster image: shapes, arrows and labels are not separate vector objects. It is not an editable pathway database or an export of a biological modeling application. You can inspect the result and use the existing figure workspace for supported revision workflows, but every revised image still needs scientific review.
If exact geometry, counts or editable vectors are essential, use a deterministic editor or a suitable authoring application. A text-panel graphical abstract template provides explicit wording and SVG output, while this biology image generator proposes a visual composition. Choose according to the actual task. For publication, verify the intended display size and readability, and consult the destination's format requirements. A downloadable raster draft should not be described as automatically journal-ready artwork.
Questions about biology figures
Is the generated diagram scientifically validated?
No. Check the biological relationships, compartments, labels and any claims against reliable source material and your study.
Is loading the example free?
Yes. It fills the exact teaching brief and does not create a task. Generating a new output requires the displayed credits and an account.
Can I download SVG?
This tool produces a raster image. It does not preserve separate editable components or guarantee vector conversion.
Does the static preview update when I type?
No. It is a saved, labeled teaching output. Your own image appears only after you actively generate and the task completes successfully. Inspect that new result independently, since its layout and errors can differ from the example.