Draw the tree your analysis produced
This phylogenetic tree maker draws a rectangular tree directly from a Newick string, the plain-text format that tree-building programs such as RAxML, IQ-TREE, MEGA, MrBayes and BEAST export. Paste the contents of a .nwk, .tree or .treefile file, choose whether branch lengths should set the horizontal distances, and update the preview. The page does not infer, re-root or re-estimate anything: the topology, the branch lengths and the node labels are drawn exactly as they appear in your text.
Use the phylogram style when the branch lengths matter, for example substitutions per site from a maximum-likelihood analysis. A scale bar is added under the tree so readers can judge distances. Use the cladogram style when you only want to show branching order: tips are aligned on the right and horizontal distances carry no meaning. Internal node labels, which most programs use for bootstrap values or posterior probabilities, can be shown next to their nodes or hidden.
Everything runs in your browser. Nothing is uploaded, there is no account, and the SVG and PNG downloads are free. The SVG keeps every branch and label as a separate vector object, so you can recolour clades or move a label in Illustrator, Inkscape or PowerPoint.
Examples you can inspect
Compare the supplied input, saved result and review points before preparing your own figure.
Example: a small primate phylogram
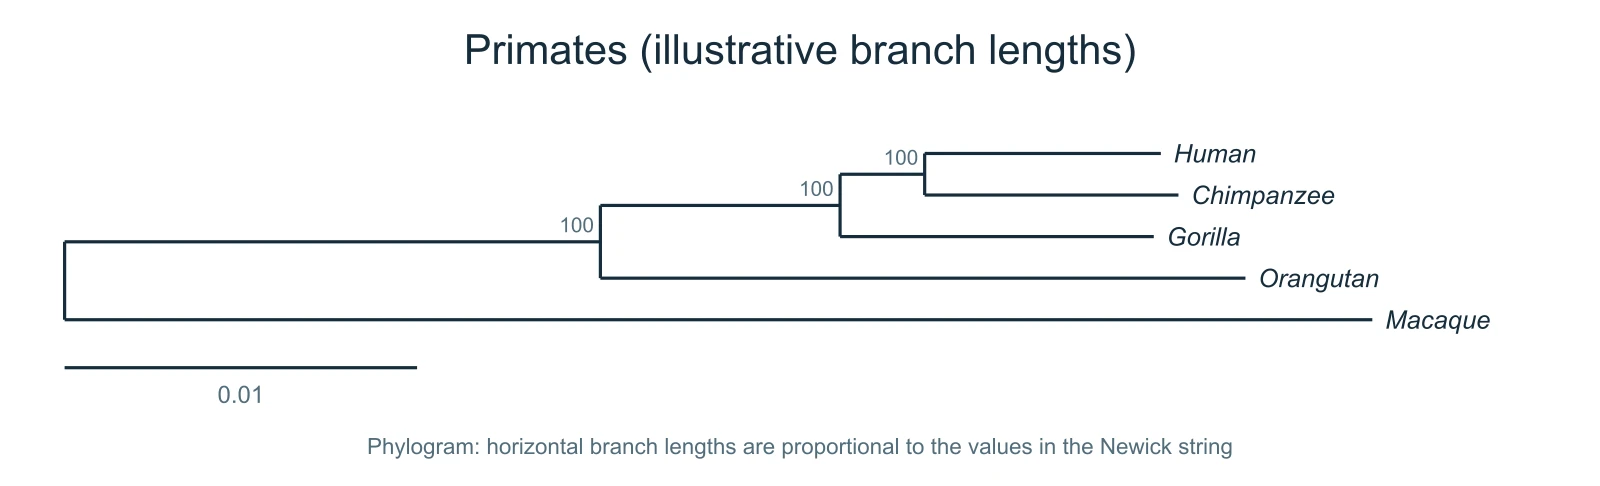
The first example is a five-taxon tree of Human, Chimpanzee, Gorilla, Orangutan and Macaque with branch lengths in the Newick string and a support value of 100 on each internal node. The branch lengths are illustrative values chosen to resemble a nuclear-sequence tree; they are not results from a specific study.
Because the phylogram style is selected, each horizontal branch is drawn in proportion to its length and a scale bar of 0.01 sits under the tree. Macaque has the longest branch, so its tip ends furthest to the right. Check that the scale bar unit matches the unit of your analysis and say what it is in the figure legend, for example substitutions per site.
Example: a cladogram with bootstrap support
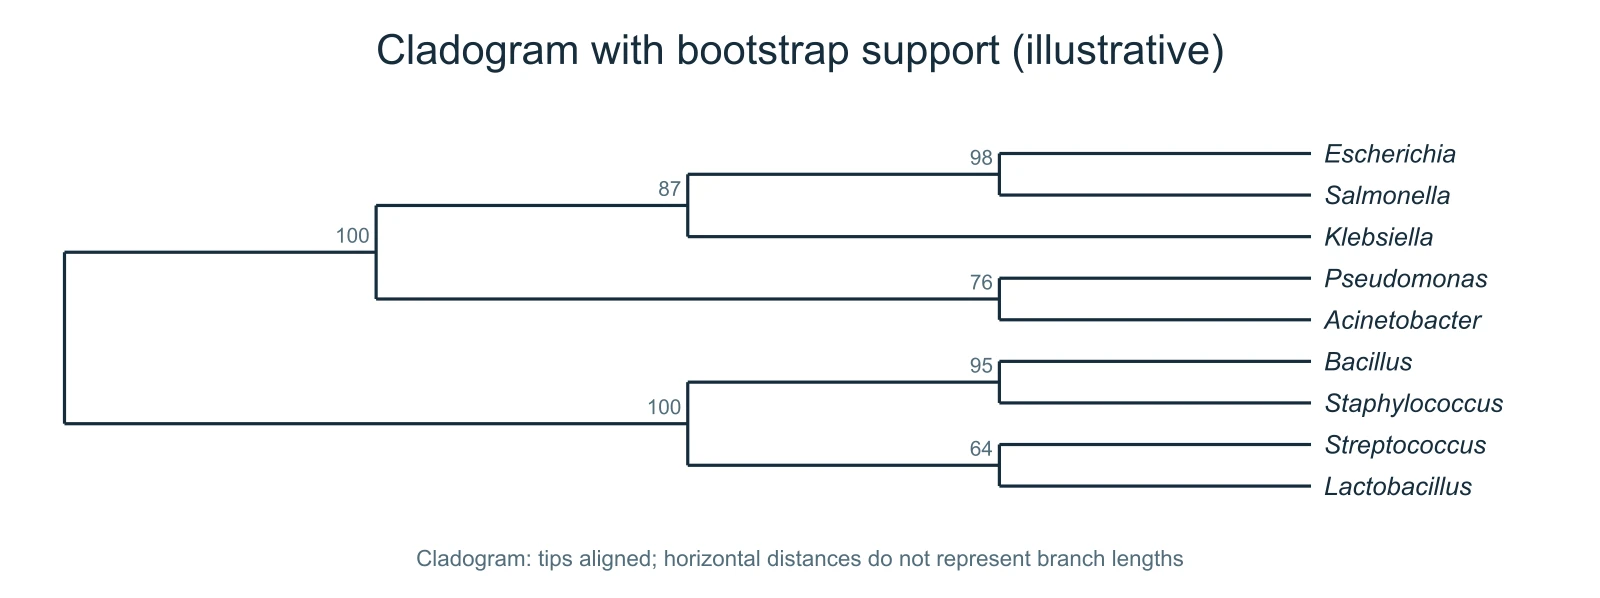
The second example contains nine bacterial genera and no branch lengths, only bootstrap values on the internal nodes. A phylogram is impossible without lengths, so the tree style is set to cladogram: the tips line up on the right and every split is drawn at a depth set by the topology alone.
The support values 98, 87, 76, 95, 64 and 100 are printed beside the nodes they belong to. When you report support, state the method and the number of replicates in the legend, and consider collapsing or marking poorly supported nodes according to your field's convention. The values in this example are illustrative.
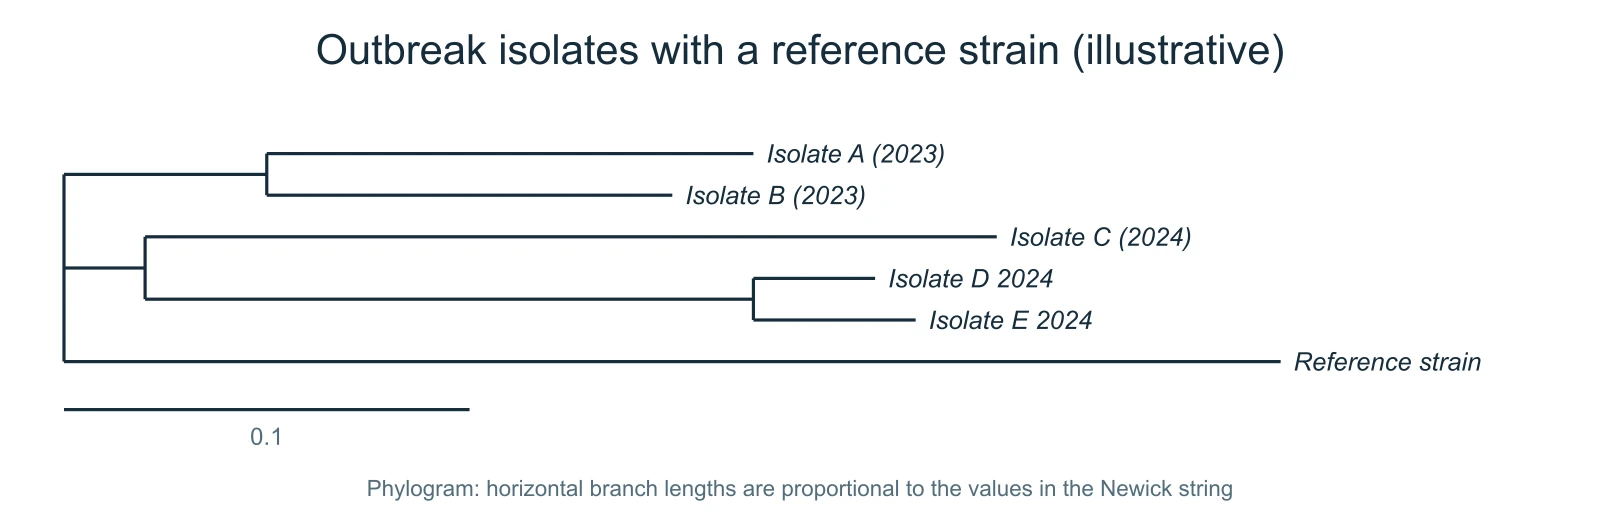
Example: isolate names with spaces and punctuation
The third example shows two ways of writing labels that contain spaces. 'Isolate A (2023)' is quoted, so the parentheses are kept as part of the name. Isolate_D_2024 is unquoted, and the underscores are shown as spaces, which is what the Newick standard specifies. A reference strain on a long branch acts as an outgroup.
Node labels are hidden in this example, and the tree is drawn as a phylogram with a scale bar of 0.1. The root of a Newick string is drawn at the left edge exactly where the file puts it; if your tree should be rooted on an outgroup, root it in your phylogenetics software before exporting the Newick text.
Getting a Newick string from your software
Most programs write the final tree as Newick automatically. IQ-TREE writes it to the .treefile, RAxML-NG to the .bestTree or .support file, and MEGA can export the current tree with File > Export Current Tree (Newick). MrBayes and BEAST produce NEXUS files; the tree itself is the text after the equals sign on the line that starts with "tree". Copy everything up to and including the final semicolon.
Square-bracket comments such as [&rate=0.5] are ignored, so annotated trees from BEAST can be pasted as they are. If your file contains several trees, paste one at a time. Trees are limited to 300 tips so that labels stay legible; for larger trees an interactive viewer such as iTOL or FigTree is more practical.
Phylogram or cladogram
A phylogram answers two questions at once: which taxa group together, and how much change happened along each branch. Choose it whenever your branch lengths come from a model of sequence evolution and readers should compare them. A cladogram answers only the first question. It is the clearer choice for trees without branch lengths, such as consensus trees from parsimony or trees assembled from the literature, and for slides where the audience only needs the grouping.
If you select the phylogram style and any branch below the root has no length, the page asks you to add the missing values or to switch to the cladogram style, rather than silently drawing a zero-length branch.
Checking the figure before you publish
Compare the tip order and the groupings with the tree in your phylogenetics software. Rotating a node does not change a tree, so a different vertical order is not an error, but every clade should contain the same tips. Confirm that the support values sit on the nodes you expect, and that the scale bar unit is stated in the legend.
If labels are long, the drawing area for the branches becomes narrower. Shorten labels in the Newick text, for example by using strain codes and explaining them in a table, rather than making the font smaller.
Questions about drawing phylogenetic trees
What is Newick format?
Newick is a plain-text way to write a tree with nested parentheses, for example ((A:0.1,B:0.2):0.3,C:0.4); where each pair of parentheses is a clade, numbers after colons are branch lengths, and the string ends with a semicolon.
Can I paste a NEXUS file?
Paste only the tree description: the part after the equals sign on the line that begins with tree, ending with the semicolon. Translate blocks that replace names with numbers are not read, so use a tree with full names.
Does the tool build the tree from sequences?
No. It draws a tree you have already inferred. Build the tree with software such as IQ-TREE, RAxML or MEGA, then paste the Newick output here.
Why are my bootstrap values not shown?
Support values must be written as internal node labels, directly after a closing parenthesis, for example (A,B)95. Check that Internal node labels is set to Show.
Can I make a circular tree?
This tool draws rectangular trees only. Rectangular layouts are easier to read in papers and slides when there are fewer than a few hundred tips.
Is my data uploaded?
No. The tree is parsed and drawn in your browser, and the downloads are created locally.