
From research text to a graphical abstract
- 1
Describe your study
Paste your abstract or separate it into four parts. Try the example to see how much detail to include.
- 2
Generate a visual draft
Check the displayed credit cost, sign in and generate one image. Your inputs stay here when you return.
- 3
Review and download
Verify the labels, arrows and scientific claims. Download the raster draft and prepare it for your intended use.
How to make a graphical abstract from research text
Paste a concise paper abstract to start, rather than an entire manuscript. For more control, Four-part brief separates the scientific question, the method, the result and the takeaway. This makes it easier to notice a missing relationship before paying for a draft. You can fill the form without an account. Load the example if you want to see the expected level of detail, then replace each field with your own study. Generation requires sign-in and uses the credits already available to your account.
In Research background, name the question and the system being studied. In Methods and relationships, describe the major objects and how they connect: sample preparation, an intervention, a processing stage or a model communication step. In Results to show, include only findings supported by your work, with units and qualifiers where relevant. In One takeaway, state the single message a reader should retain. If the figure is a conceptual illustration rather than a results summary, say so explicitly.
The abstract accepts up to 12,000 characters; each structured field accepts up to 3,000. Short labels usually produce a clearer visual narrative than paragraphs inside the figure. Preserve essential terms, abbreviations, group names and directions. If a model must show a comparison, name both sides and the shared evaluation condition. If no quantitative result belongs in the image, request a qualitative workflow instead of inviting the model to fill the gap with invented percentages.

Describe a layout that expresses the study
A graphical abstract should communicate one research story at a glance. A left-to-right arrangement suits preparation, intervention and observation. A central-system layout suits a mechanism with interacting components. A side-by-side comparison suits two conditions evaluated on the same basis. The tool defaults to a left-to-right narrative. Describe a different arrangement in the methods field if necessary. These are instructions for the visual brief, not promises that every generated image will follow a layout perfectly. The model returns a raster draft, so review its structure before investing in a polished final figure.
Avoid turning the abstract into a miniature poster. A dense introduction, a complete methods section and every secondary result compete with the main message. Decide which element is the visual anchor, which relationships explain it and which labels can move to a caption. Use color consistently for a group or process, and retain an additional cue such as a label or arrow style so meaning does not depend on color alone. Read the figure at the size your audience will actually see.

A visual language for your field
Explore a tool-generated teaching example and two existing catalog illustrations. Compare the source, visual result and review points. The catalog images’ original model and rendering date are unverified.
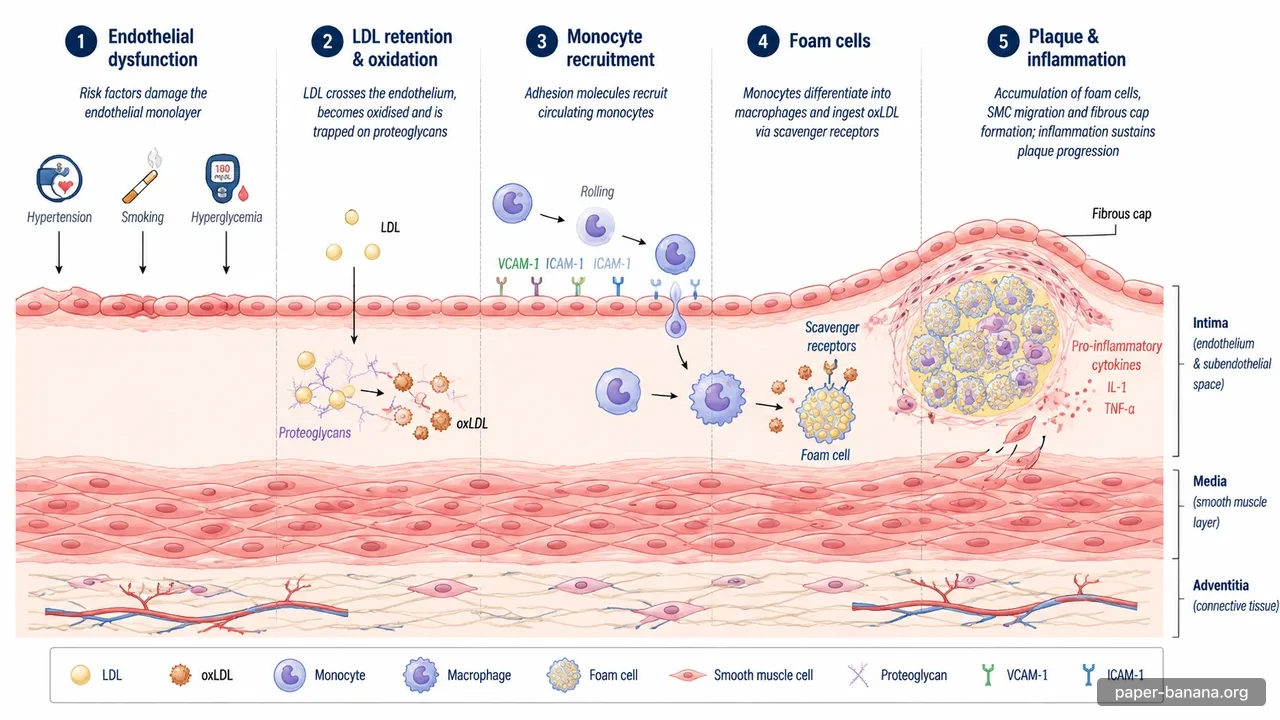
Biology: a mechanism with a clear sequence
Suggested brief: Describe the studied cell type, intervention and observed mechanism. Keep established background separate from your own experimental finding.
Visual result: This catalog illustration arranges a vascular mechanism into five stages. The useful design choice is the reading order: each stage names a process, while the artery cross-section provides a shared spatial reference. To create a research-specific abstract, replace this broad overview with the processes that your study actually investigated. State which cell type, intervention and observation belong together. Do not add a treatment benefit or causal pathway simply because it would make the narrative more complete.
What to check in this example
Inspect the image rather than accepting its polished appearance. Some adhesion-molecule labels are malformed or duplicated, and the anatomical labels and arrow meanings require expert verification. A review article may need a mechanism overview; an experimental paper usually needs a narrower intervention-to-observation story. This illustration is a teaching example, not validated medical evidence or a journal-approved figure.
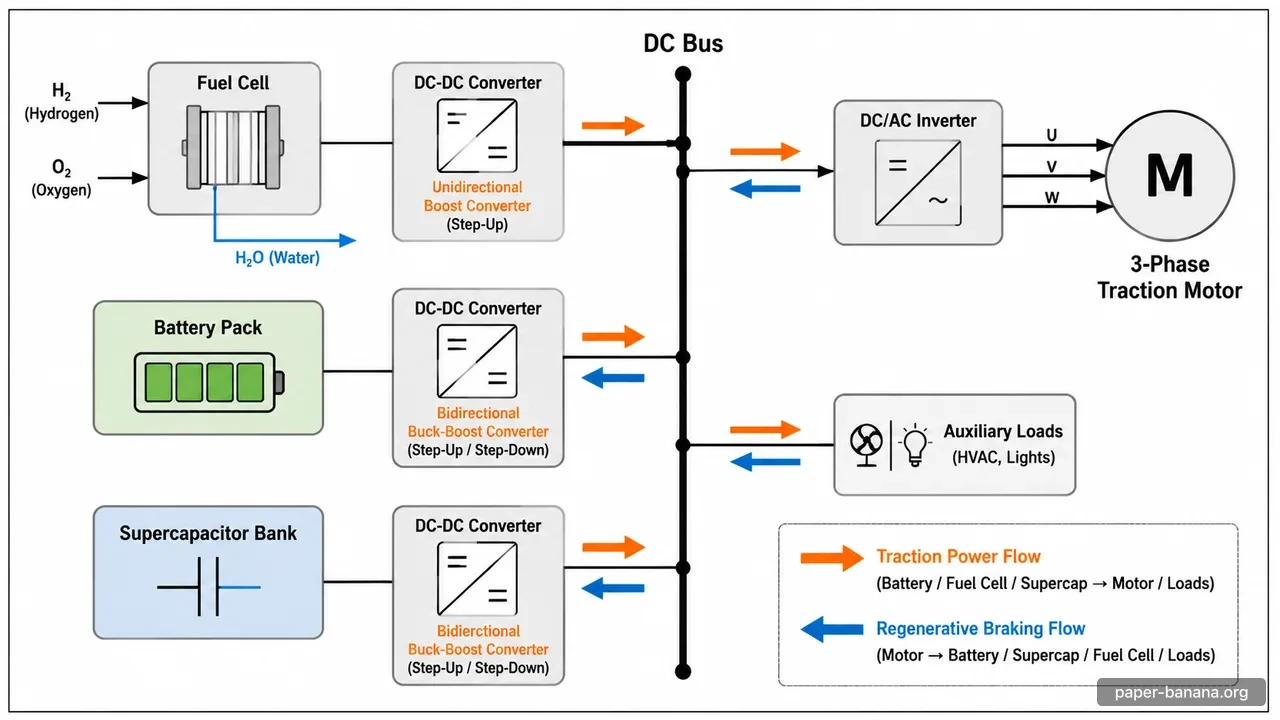
Engineering: separate power flow from a finding
Suggested brief: Name the components, allowed power-flow directions, controller change and measured outcome. Specify which branches are unidirectional.
Visual result: The energy-storage example uses a central bus to connect several components. This is a useful starting point when the relationship between parts matters more than a chronological sequence. A graphical abstract for an engineering paper should also explain what changed: a controller, a converter arrangement, an operating condition or a measured outcome. Put the contribution beside the system, rather than filling every available space with extra components. Include numerical improvements only when they are present in your source text.
What to check in this example
The regenerative-flow legend in this catalog image deserves particular scrutiny. It lists the fuel cell and loads as regenerative destinations, although the fuel-cell converter is labeled unidirectional. The fuel-cell branch itself shows an orange forward arrow, not a blue reverse arrow. Use this discrepancy as a concrete review exercise: specify allowed directions in the brief and verify the rendered arrows. Attractive engineering schematics can still contradict their own labels.
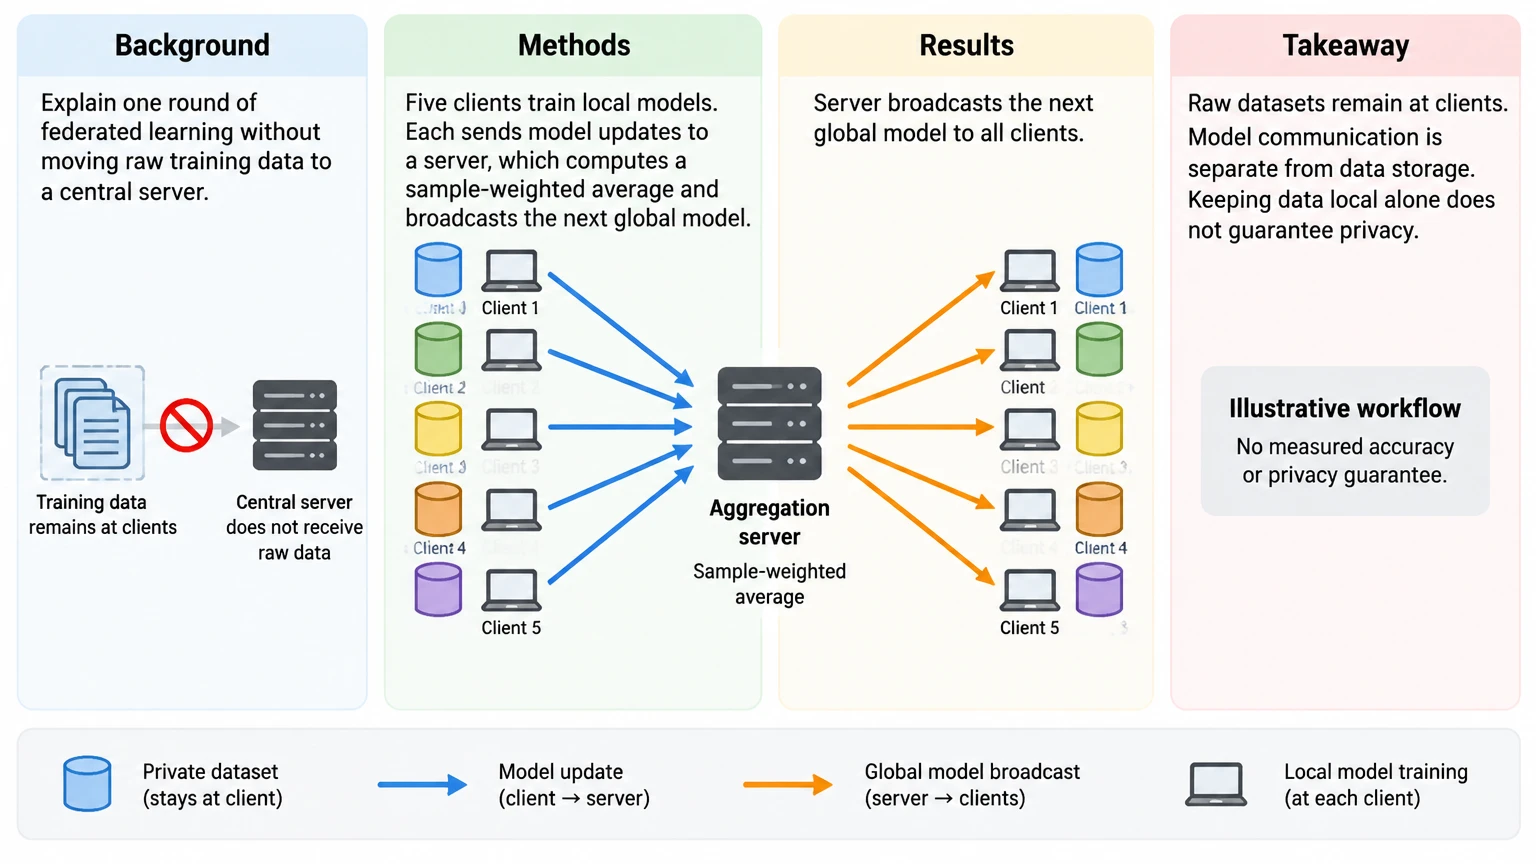
Machine learning: distinguish data from updates
Source brief: Five clients train locally, send updates for sample-weighted averaging and receive the next global model. Raw datasets stay local.
Visual result: Explain a federated-learning round while keeping raw datasets local. This image was generated from the exact four-part teaching brief loaded above, using the same Sunburst provider helper and image settings. It is a real model output, not a hand-built ideal diagram. Loading the brief is free; generating your own version creates a paid task and can produce a different layout. This example illustrates communication, not a measured accuracy improvement or a formal privacy guarantee.
What to check in this example
The five clients and main communication directions match the brief. Some client labels are faint, duplicated or incomplete, and the image repeats more prose than the requested short labels. Correct these before publication. The Results panel describes a workflow, not an experimental finding: the teaching source contains no measured accuracy result. Do not read local data storage as a privacy guarantee. Review the raster draft at the final display size.
The full example brief you can load
This is illustrative research text, not findings from a real experiment. The example keeps observations separate from privacy and performance claims.
- background
- A research team wants to explain one round of federated learning without moving raw training data to a central server.
- methods
- Five clients train local models. Each sends model updates to an aggregation server, which computes a sample-weighted average and broadcasts the next global model.
- results
- The diagram should distinguish private datasets, outgoing model broadcasts, and incoming model updates. This is an illustrative workflow, with no measured accuracy or privacy guarantee.
- conclusion
- Raw datasets remain at clients. Show model communication separately from data storage; do not imply that keeping data local alone guarantees privacy.
Review the draft before requesting another generation
Begin with meaning, then examine appearance. Compare the generated figure against your brief: count the groups, follow every arrow, check the order of stages and read all labels aloud. Verify quantities, units, spelling, subscripts and mathematical notation. A missing connector can reverse a mechanism, while an extra arrow can imply a causal relationship your experiment never tested. An attractive draft is not evidence that the science is correct.
Write down one concrete correction for each defect. For example, replace “make it better” with “show one outward broadcast arrow and one inward update arrow per client; keep private datasets disconnected from the server.” Update the relevant field and request a new draft only when the changes are ready. Regeneration creates a new billable task. This tool does not provide direct manipulation of individual shapes, editable text layers or guaranteed preservation of unchanged objects.
Download formats, pixel size and submission requirements
Defaults are Sunburst, Default quality, 16:9 PNG and English labels. Choose either supported model, aspect ratio, quality, PNG/JPG/WebP, one to four images and label language. The button shows the total; images are billed separately. Download extensions follow the returned type. Verify dimensions and journal requirements; these raster outputs contain no separately editable vector objects.
Effective resolution depends on both pixel count and intended physical size. A 1,200-pixel-wide image placed at four inches has 300 pixels per inch; the same file placed at eight inches has 150. Changing a resolution label without adding meaningful image detail does not improve the original. Inspect thin lines and small labels at the intended display size. If the submission system requires a format this tool does not export, prepare the final file in suitable external software.
Check the current instructions for your target journal before submission. Requirements can differ by publication and article type, including whether a graphical abstract is accepted, its dimensions, file format and the treatment of AI-assisted imagery. Keep the source text, downloaded draft and a record of your corrections. The publisher guidance linked below is a starting point; it does not certify this tool or replace your journal’s own author instructions.
Credits, sign-in and interrupted tasks
The Generate button displays the credit cost before submission. This page uses existing account credits and does not grant a separate trial for this tool. Signing in or loading the example does not submit a generation. After sign-in, review the inputs and click Generate yourself. Draft inputs are retained in this browser tab where session storage is available; you can clear them using Clear inputs. Browser restrictions or closing the tab can remove that local copy.
If a task has been accepted, Resume checking queries that same task rather than creating a replacement. If the submission response is lost, the page cannot know whether the server created a task. Check task history and your balance before enabling another generation. No automatic paid retry is sent. A failed task, unavailable model or insufficient balance should be resolved using the existing account workflow; the page does not promise a refund rule beyond what that workflow actually provides.
Frequently asked questions
Can I use a paper abstract directly?
Yes. Paste your abstract directly, or use Four-part brief to specify the question, method, finding and takeaway. This page does not upload or parse a PDF.
Can I export editable SVG?
This workflow generates raster images and offers an image download; it does not provide native vector layers.
Can I change one label without changing the figure?
Direct object-level editing is not available here, and a new generation can change other details. Regeneration creates a new billable task.
Is every generated figure suitable for publication?
No. Authors remain responsible for scientific accuracy, disclosure, permissions and journal requirements. Check labels, units, arrows and notation against your paper.
Can I use confidential research?
Only submit material you are permitted to send through the existing generation service; remove identifying information when it is unnecessary.
Does the page guarantee exact numbers and arrows?
It asks the model to preserve them, but you must verify the rendered result. For exact plots or counted flow diagrams, use a deterministic tool suited to that task.
Publisher guidance and other workflows
Review the publisher’s graphical abstract guidance and your target journal’s current instructions. For reference-image options, open the existing figure workspace.