Reconcile a new review's search pathway
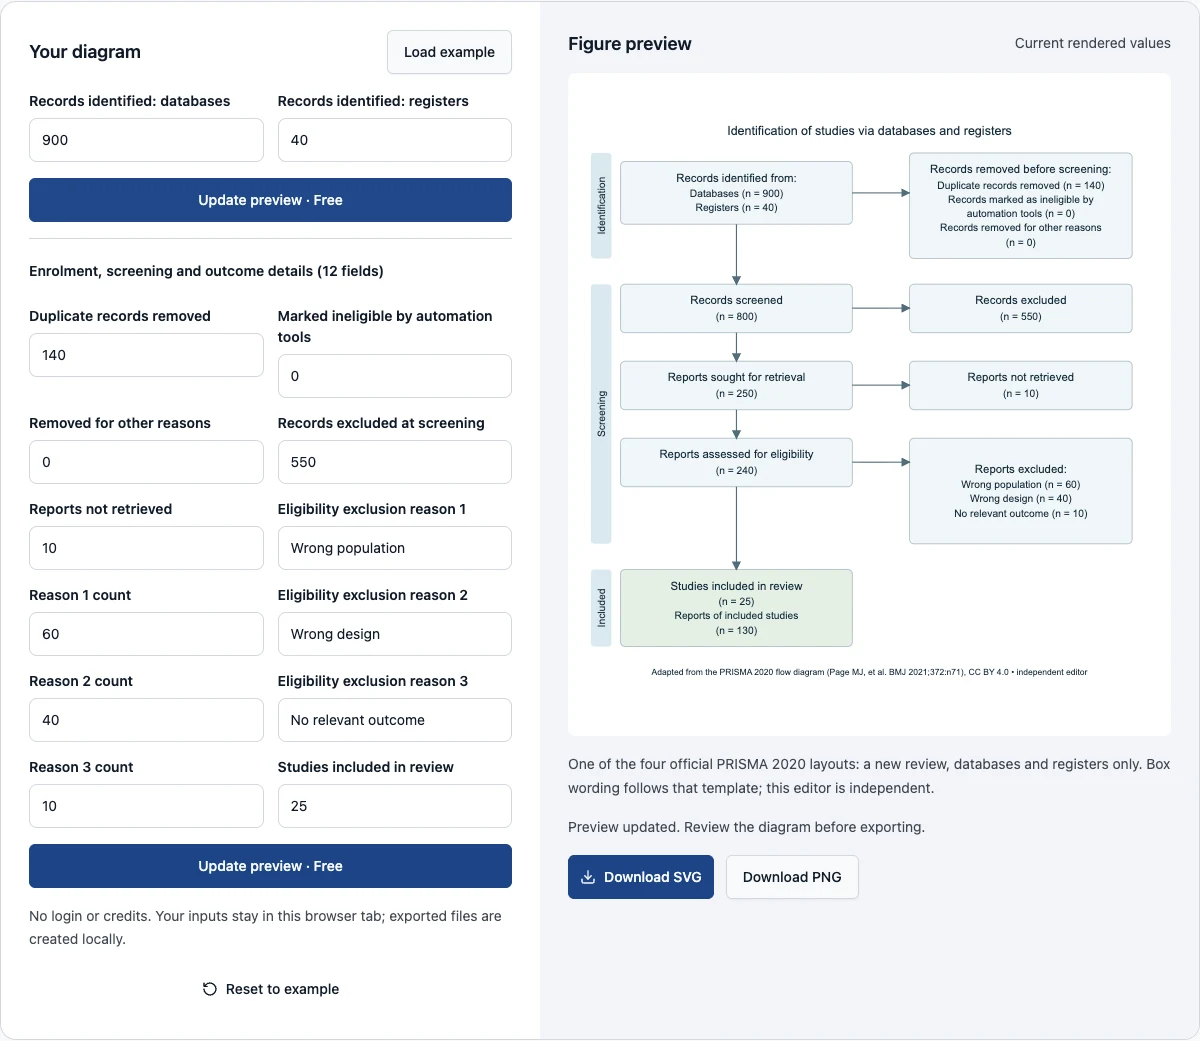
This PRISMA 2020 flow diagram generator covers one of the four official PRISMA 2020 flow diagram templates: a new systematic review that identified records through databases and registers only. Its boxes use the wording and the three phases of that template, Identification, Screening and Included, and the export carries the attribution the template's license requires. It draws the counts you enter and calculates the intermediate totals, making inconsistent removals visible before export. It is an independent editor, not an official PRISMA application or a substitute for the reporting checklist. Reviews that used other identification methods, or that update a previous review, need one of the other three templates.
Begin with the fictional example and replace its identification totals. Open the screening and outcome fields to enter removals, unavailable reports and eligibility exclusions. The preview updates only when you request it. If a count would make a downstream total negative, the editor retains the last valid figure and disables downloads. Export the corrected SVG for further editing or PNG for a raster copy. The calculation and drawing run locally without login, credits or a server submission of your review counts.
Examples you can inspect
Compare the supplied input, saved result and review points before preparing your own figure.
Example: records, reports and studies differ
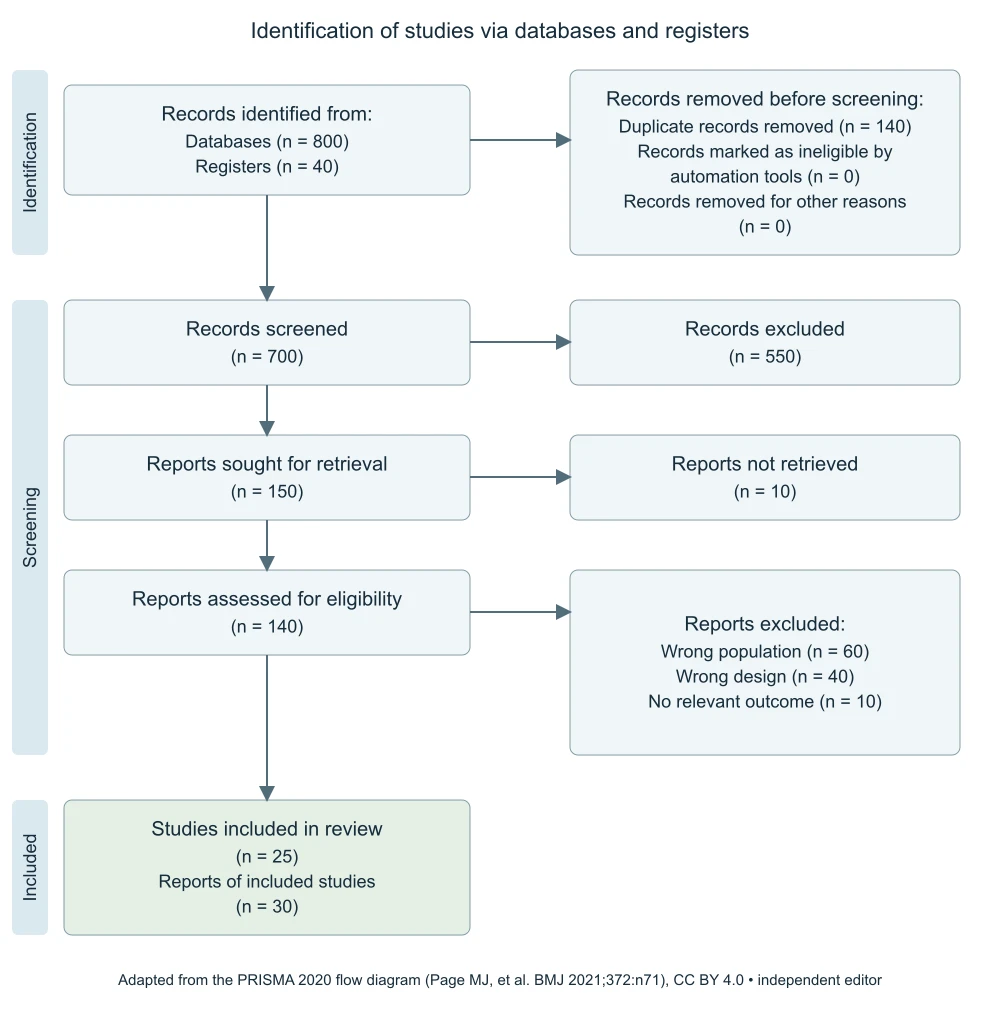
The first example starts with eight hundred database records and forty register records. Removing one hundred forty duplicates leaves seven hundred records for screening. Excluding five hundred fifty at that stage leaves one hundred fifty reports sought for retrieval. Ten are not retrieved, leaving one hundred forty assessed reports. Eligibility exclusions of sixty, forty and ten leave thirty included reports. The input identifies twenty-five unique included studies, showing why reports and studies are not interchangeable.
Use this example to trace every subtraction rather than copying its numbers. Several reports may describe one study, so the included-study count can be lower than the included-report count. The editor checks that studies do not exceed reports and that positive included reports have a positive study count. That is an arithmetic consistency check, not proof of correct study grouping. Keep the report-to-study mapping in your review records so that the final figures remain reproducible.
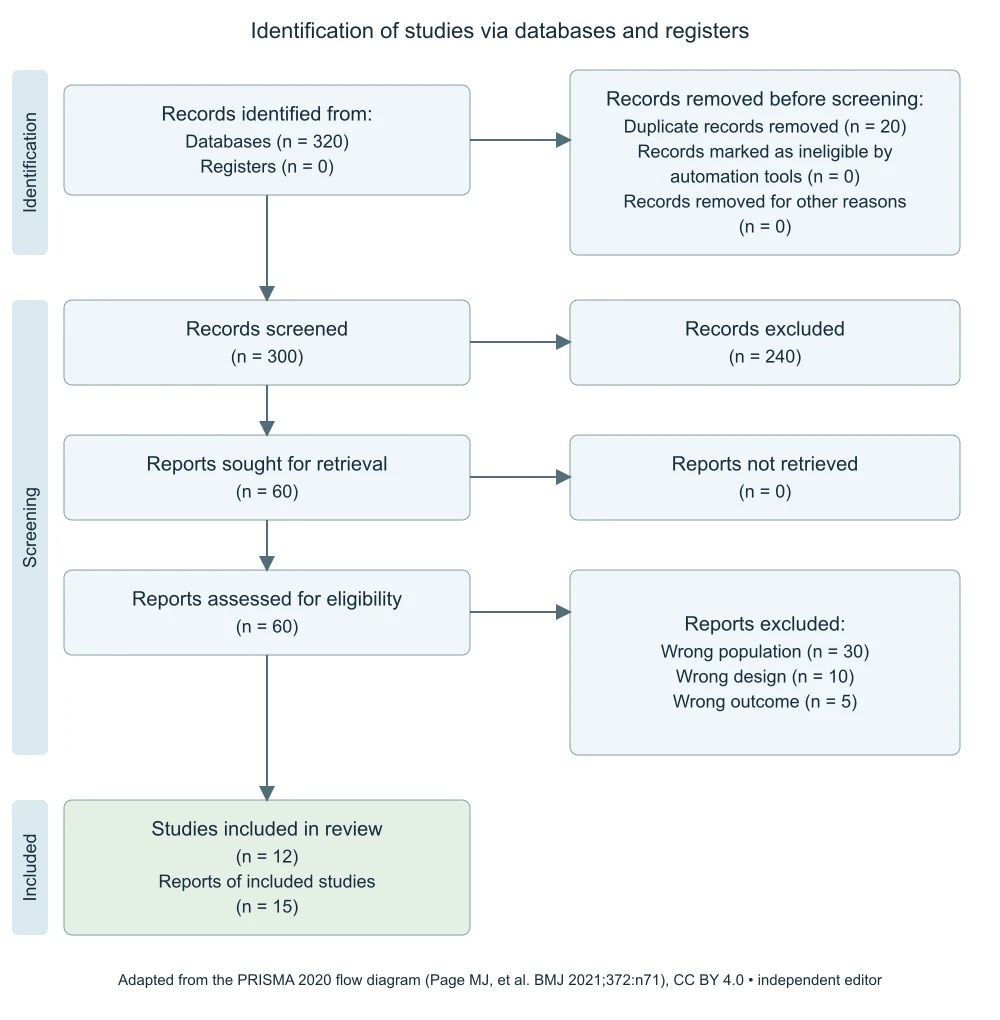
Example: a smaller database-only search
The second example uses three hundred twenty database records and no register records. Twenty duplicates leave three hundred screened records. After two hundred forty screening exclusions, sixty reports are sought and all are retrieved. Thirty reports are excluded for population, ten for design and five for outcome, leaving fifteen included reports that correspond to twelve studies. A zero register count is visible rather than silently removed from the independently drawn layout.
This example is useful when checking whether an unused source type is genuinely absent or simply unrecorded. Zero means you have a supported count of zero, not that a field is unknown. If your source logs do not record a value, investigate them before entering a convenient default. The final diagram should agree with your search documentation, screening exports and inclusion table. Formatting a flow chart is the last stage of that reconciliation, not a way to reconstruct missing evidence.
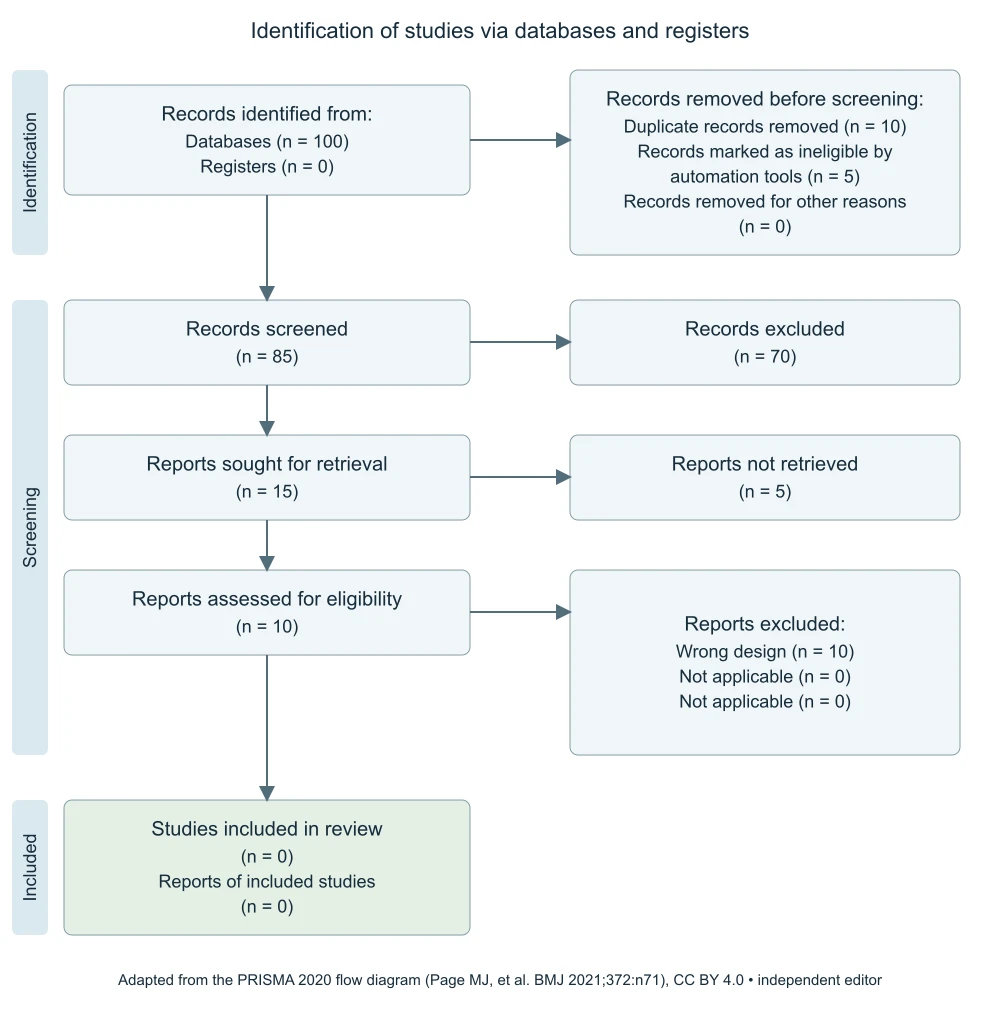
Example: a review with no included studies
The third example starts with one hundred records. Ten duplicate records and five automation removals leave eighty-five for screening. Seventy are excluded, fifteen reports are sought and five are not retrieved. All ten assessed reports are then excluded for design. There are zero included reports and zero included studies. The editor permits this outcome because a complete, documented review can legitimately find no eligible studies.
Do not change the counts to make the final box look more satisfying. Instead, verify that each exclusion is supported and explain the implications in the review itself. This example also checks that unavailable reports and eligibility exclusions occur at different stages. A report that was not retrieved cannot also be counted among assessed reports unless it was subsequently obtained and your final records have been updated. Keep the source log authoritative, then regenerate the figure from the reconciled totals.
Gather counts from auditable records
Use your search logs for identification counts and your screening system for decisions. Freeze a reporting date so that the chart does not mix an earlier search export with a later screening state. Record how duplicate detection was performed and whether automation removed records before human screening. The fields distinguish duplicate records, records marked as ineligible by automation tools and records removed for other reasons, as the official template does. Where feasible, the template also suggests reporting the number of records from each database or register; this editor shows the two totals, so keep the per-source counts in your caption or search appendix.
The diagram generator does not connect to bibliographic databases, perform deduplication or decide whether a study is eligible. It cannot infer counts from a methods paragraph. Those activities remain in your review workflow. If your database exports include multiple versions or overlapping searches, reconcile them before entering totals. Preserve the underlying files and decision rules so that a collaborator can recreate the subtraction chain independently of this page.
If a late correction changes one stage, trace the effect through every later stage before regenerating the diagram. For example, a revised duplicate count changes screened records, sought reports and ultimately the number of included reports unless other source decisions also changed. Record the reason for the correction and retain the earlier count table when your review documentation requires it. A new chart can display the corrected snapshot, but the editor does not preserve a version history of those decisions.
Follow the arithmetic through each stage
Records screened equals database records plus register records, minus duplicates, automation removals and other pre-screen removals. Reports sought equals screened records minus screening exclusions. Reports assessed equals reports sought minus reports not retrieved. Included reports equals assessed reports minus the three eligibility-exclusion counts. Each stage must remain nonnegative. The tool computes these intermediate values, so you edit source counts rather than typing a conflicting screened total separately.
The calculation assumes the reporting pathway fits this simplified layout. It is not a universal reconciliation engine for every review design. In particular, the editor has no separate other-methods branch, no prior-review inclusion branch and no arbitrary list of exclusion categories. If your process requires them, use the appropriate official template or another verified editor. Never collapse distinct pathways merely to make the available form produce a neat figure.
Explain eligibility exclusions accurately
The editor provides three labeled eligibility-exclusion categories. Use concise, mutually exclusive reasons with supported counts. If your review uses more than three categories, combine them only when the combined category remains meaningful and your detailed exclusion information is preserved elsewhere. Do not erase important distinctions to meet the layout. Reason labels are short enough to stay readable in the right-hand box; lengthy explanations belong in the review and supporting records.
A report should not appear under several exclusion reasons in this simplified total unless your documented counting method resolves that duplication. The tool subtracts each category, so overlapping categories would incorrectly reduce included reports. Check the sum of exclusions against the assessed-report log. The generator cannot determine the validity of an exclusion reason or whether reviewers applied the criteria consistently. Its role is to expose the arithmetic and render the final documented choices. If automation tools excluded records during screening, the official template asks you to state how many were excluded by a human and how many by the tools; add that split to your caption, because the editor has a single records-excluded count.
Distinguish reporting compliance from a chart
A completed flow diagram is one part of transparent review reporting. It does not demonstrate that the search was exhaustive, the protocol was followed or the risk-of-bias assessment was adequate. The official PRISMA guidance provides the broader reporting framework and several flow templates. Use the version applicable to your review and confirm any extension requirements. The source link below is provided so you can inspect that guidance directly rather than treating this independent page as authoritative approval.
The export is headed Identification of studies via databases and registers, as in the official template, which is distributed under a CC BY 4.0 license. Keep that heading and the attribution line if you edit the SVG after downloading. Removing them does not add the missing pathways. Likewise, the presence of balanced totals does not establish that the underlying search or screening decisions are correct. Arithmetic checks are valuable precisely because they are narrow and inspectable; their limits should remain visible to authors and readers.
Export and inspect the final diagram
The SVG retains labels, counts, boxes and connecting arrows as vector elements. Use a compatible editor to adjust typography or add source-level detail required by your journal. Check that each arrow still leads to the correct stage after editing. The PNG is a flattened raster copy of the same layout, useful for drafts and presentations. It does not offer a Word document, editable spreadsheet or automatically submission-ready PDF.
Inspect the file at its eventual printed size. The chart is vertically arranged and may become small when fitted to a compact column. Preserve readable numbers and shorten category labels before shrinking the entire figure. Compare the exported values with your frozen source log, then include a suitable caption and attribution where applicable. Save the entered values outside the browser as part of your review record; local draft restoration is a convenience, not a durable audit archive.
Questions about this PRISMA editor
Does it cover updated reviews or other sources?
No. This version covers new reviews with databases and registers only. Use the applicable official template when your pathway includes previous reviews, websites, organizations, citation searching or other identification methods.
Are the numbers validated scientifically?
The page checks arithmetic relationships and basic nonnegative whole counts. It does not validate search quality, eligibility decisions or the report-to-study mapping.
Can I download an editable file?
SVG is editable in compatible vector software. PNG is a raster copy. The page does not create a Word template or certify journal compliance.
Why is export disabled?
Your input changed or a consistency check failed. Update the preview after correcting the count or label. The last valid diagram remains visible so you can compare it, but it should not be mistaken for a successful rendering of the invalid inputs.
Check the applicable reporting guidance
Official PRISMA 2020 flow diagram templates. This independent tool does not certify reporting compliance.