Make a bar graph with error bars from your data
This tool draws a bar graph with error bars in two ways. If you already have summary statistics, enter one bar per line as label, mean and error value, optionally followed by the group size: Wild type, 12.4, 1.1, 6. If you have the raw measurements, switch to raw values and write the group name, a colon and the values; the page calculates the mean and the standard deviation or standard error for you and draws every value as a dot over its bar.
Error bars can show the standard deviation, the standard error of the mean, or a 95% confidence interval. Whatever you choose is printed under the graph, because an error bar without a stated type cannot be interpreted. Bars always start at zero, and negative means are drawn below a zero line.
Nothing is uploaded and no account is needed. Download the graph as SVG to edit it in a vector editor, or as PNG for slides and reports.
Examples you can inspect
Compare the supplied input, saved result and review points before preparing your own figure.
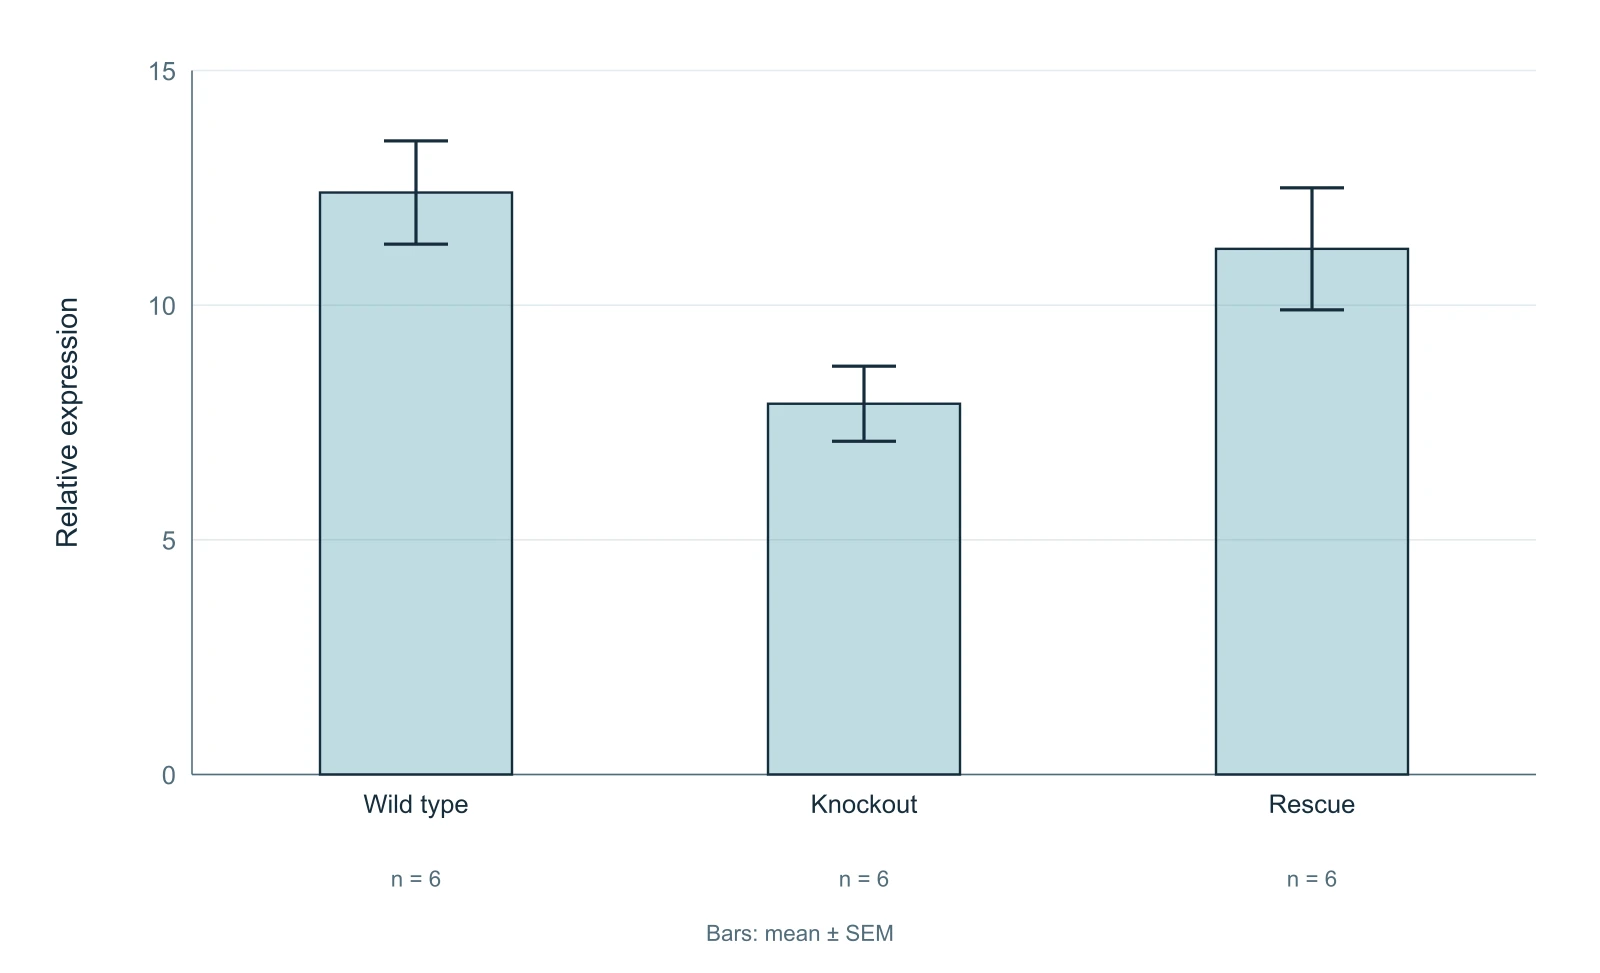
Example: three genotypes with SEM
The first example uses summary statistics for three illustrative genotypes, each with n = 6: wild type 12.4 ± 1.1, knockout 7.9 ± 0.8 and rescue 11.2 ± 1.3, where the error values are standard errors of the mean. The group sizes are printed under the bars because the SEM depends on n and readers need it to judge the error bars.
If your error values are standard deviations, select SD instead. The bars do not change, but the label under the graph does, and the figure is then described correctly.
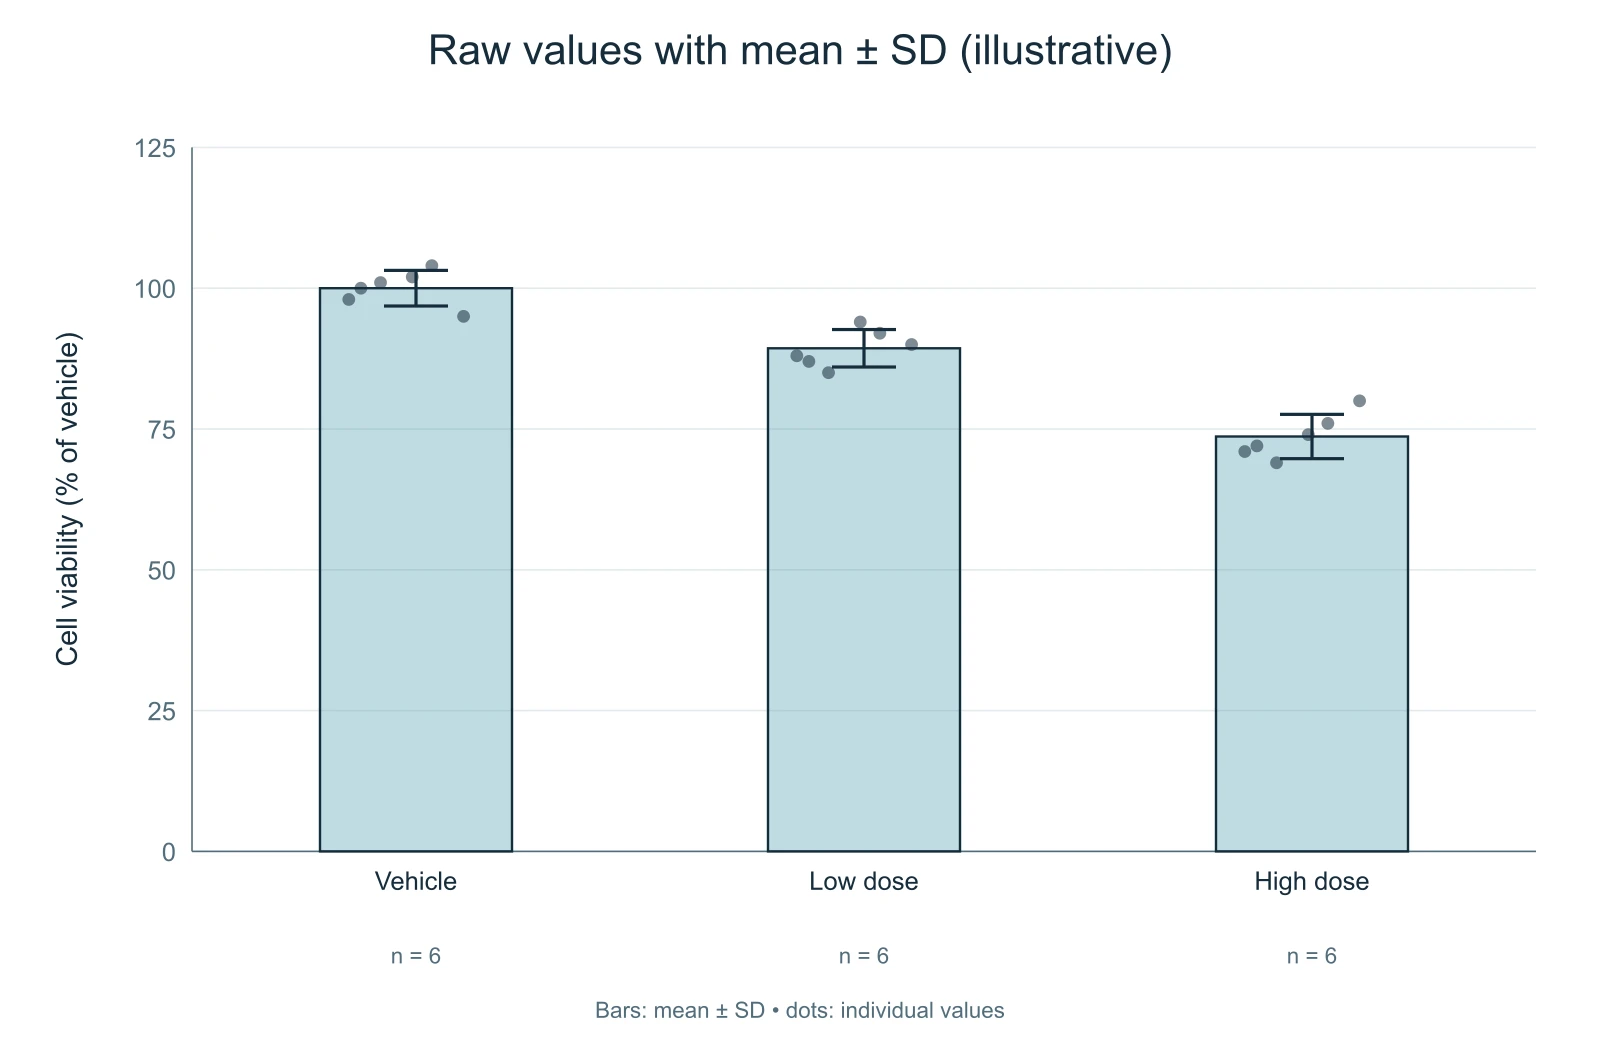
Example: raw values with mean ± SD
The second example switches to raw values: six illustrative cell-viability measurements per treatment. The page computes each mean and the sample standard deviation, which divides by n − 1, draws the bars and overlays every measurement as a dot.
Showing the individual values matters with small samples. Two groups can share a mean and a standard deviation while having very different distributions, and the dots make that visible. If the spread itself is your main point, consider a box plot instead.
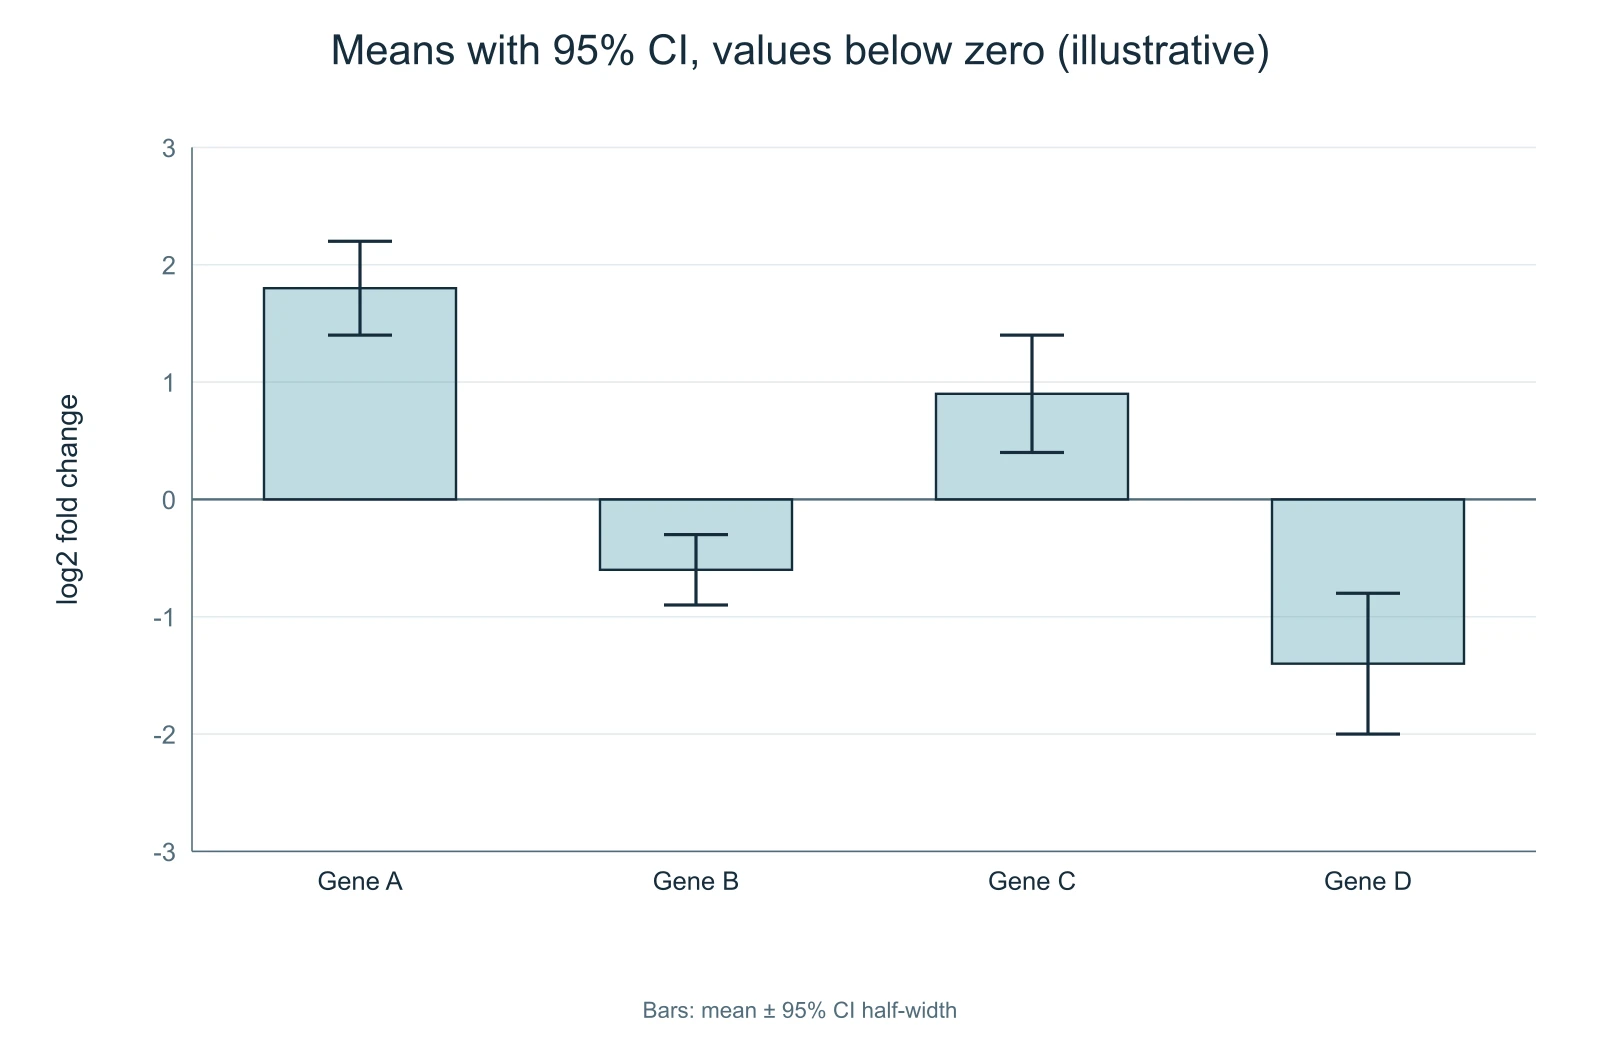
Example: means below zero with 95% CI
The third example plots illustrative log2 fold changes for four genes, two of them negative, with error values given as 95% confidence interval half-widths. Gene B has a mean of -0.6 with a half-width of 0.3, so its interval runs from -0.9 to -0.3 and does not include zero.
Confidence intervals are entered as half-widths in summary mode. The page does not compute confidence intervals from raw values, because the correct interval depends on your model and design; calculate them in your statistics software and enter the result.
SD, SEM or confidence interval?
The standard deviation describes how spread out the individual values are. The standard error of the mean describes how precisely the mean is estimated and shrinks as the sample grows. A 95% confidence interval gives a range of plausible values for the mean. They answer different questions, so choose the one that matches the point of the figure, and never leave the type unstated.
SEM bars are the shortest of the three and are sometimes chosen to make differences look clearer than they are. Many journals ask authors to state the type of error bar and the value of n for every figure, and some discourage SEM for small samples. Check your target journal's figure guidelines.
When a bar graph is not the right choice
Bar graphs suit counts and proportions, and means of data that are roughly symmetric. For small samples, skewed data or results where the spread is the message, a dot plot or a box plot shows more. You can keep the bar graph and show the raw values as dots, which this tool does automatically in raw mode, or use the box plot maker on this site.
Questions about error bars
What does each error bar show?
The type you selected: the standard deviation, the standard error of the mean, or a 95% confidence interval half-width. It is printed under the graph.
How is the standard deviation calculated from raw values?
As the sample standard deviation, dividing by n − 1. The standard error is that value divided by the square root of n.
Why can't I compute a confidence interval from raw values?
The appropriate interval depends on your design and model, so enter the half-widths you calculated in your statistics software in summary mode.
Can the bars be negative?
Yes. Negative means are drawn below a zero line, which is useful for changes and differences.
Is my data uploaded?
No. The calculations and the drawing happen in your browser.