Make a box plot from your own values
This box plot maker draws a box-and-whisker plot from the values you paste, one group per line. Write the group name, a colon and the values, for example Control: 4.1, 4.8, 5.0. Values can be separated by commas, spaces, tabs or semicolons, so a row copied from a spreadsheet usually works as it is. Each group needs at least three values, and you can compare up to twelve groups.
The box spans the first to the third quartile, the line inside it is the median, and the whiskers follow the rule you choose. Quartiles are calculated by linear interpolation between ordered values, the default method in R, NumPy and Excel's QUARTILE.INC, so the numbers match what most statistics software reports. The method and the whisker rule are printed under the plot, and the group size appears under each box.
The figure is drawn in your browser without uploading anything. Download it as SVG to edit colours and labels in a vector editor, or as PNG for slides and documents. No account or credits are needed.
Examples you can inspect
Compare the supplied input, saved result and review points before preparing your own figure.
Example: three groups with an outlier
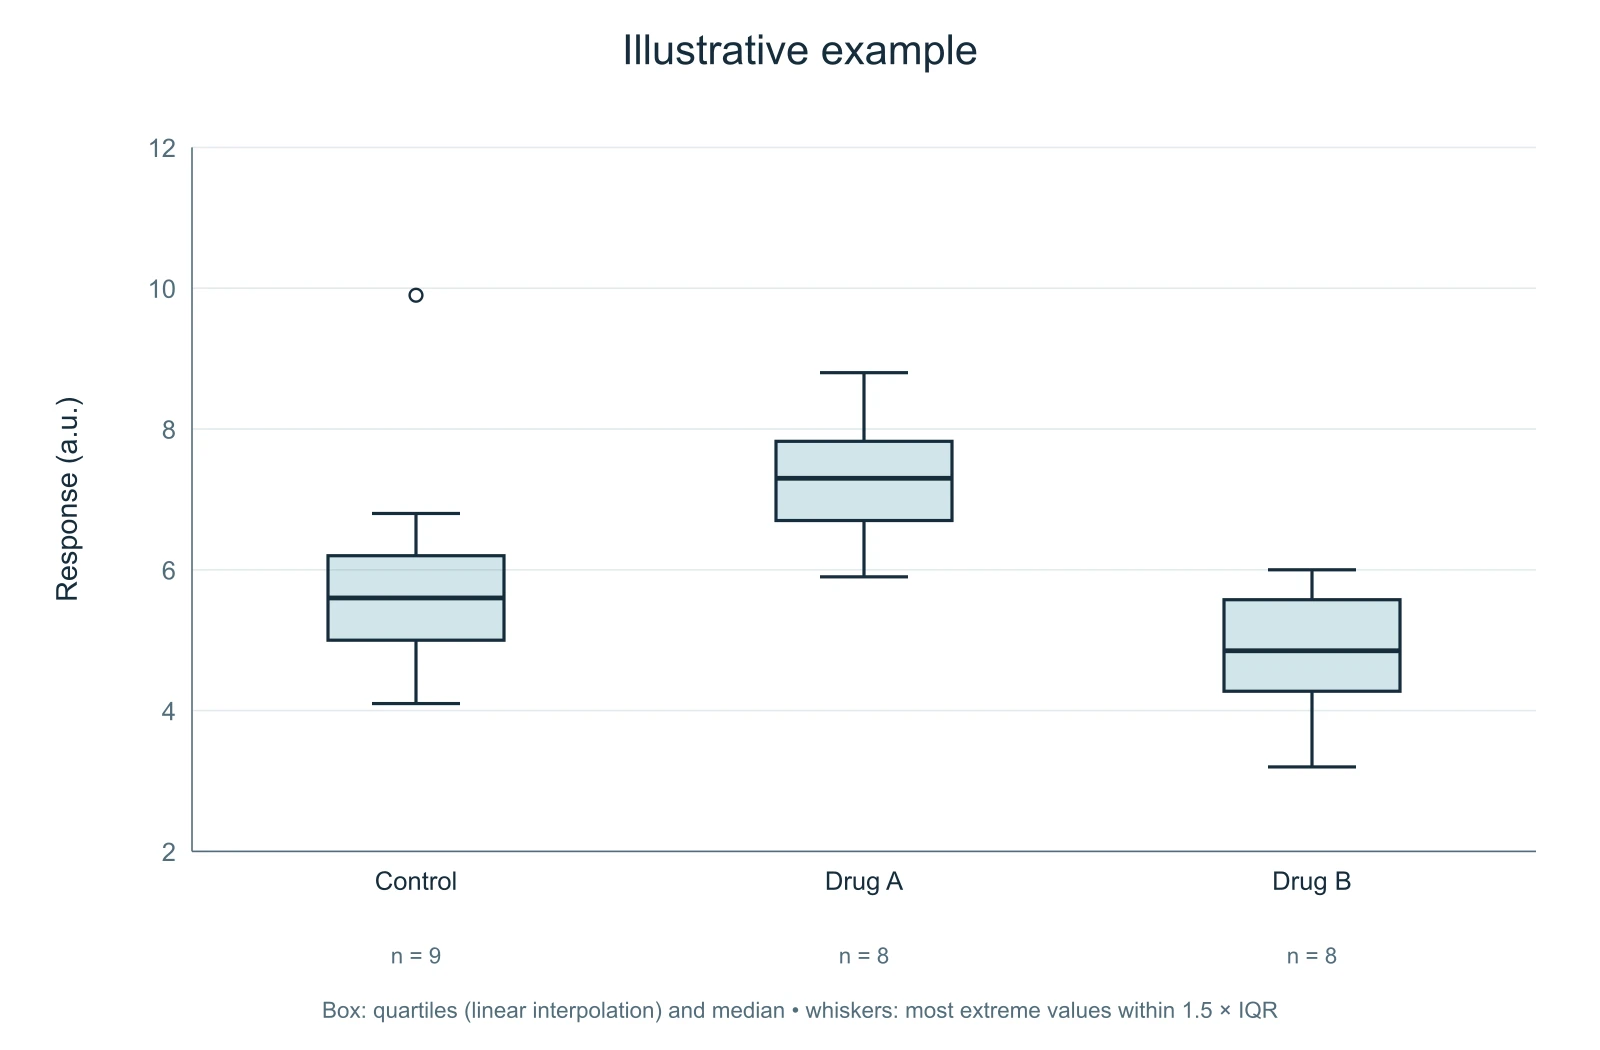
The first example compares a control group with two treatments, using illustrative values. With Tukey whiskers, the upper whisker of the control group stops at 6.8, the largest value within 1.5 times the interquartile range above the third quartile. The value 9.9 lies beyond that fence and is drawn as an open circle.
For the control group the first quartile is 5.0, the median 5.6 and the third quartile 6.2, so the interquartile range is 1.2 and the upper fence is 6.2 + 1.8 = 8.0. Checking one group by hand like this is a quick way to confirm that a box plot shows what you think it shows.
Example: every value shown
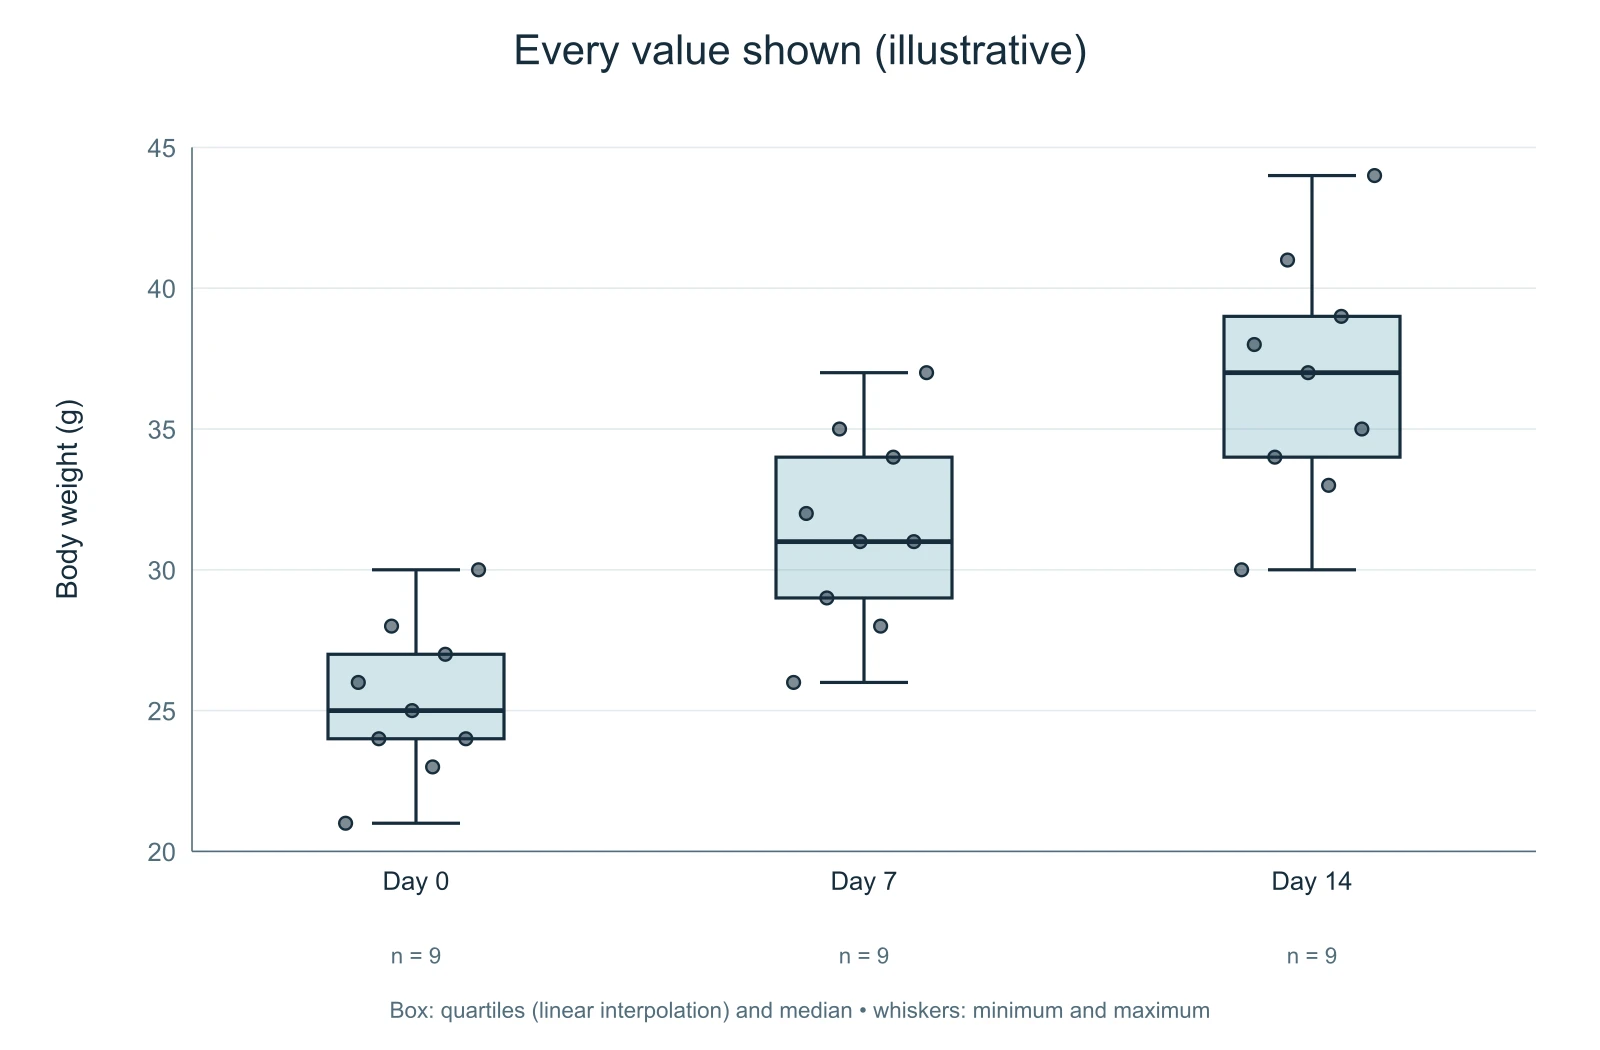
The second example tracks body weight at three time points, with nine illustrative values per group. Here the whiskers run from the minimum to the maximum and every value is drawn as a dot on top of the box. Showing the individual values is good practice for small samples, because very different distributions can produce the same five-number summary.
The dots are spread sideways by a fixed pattern rather than at random, so the same data always produce the same figure. The horizontal position of a dot inside its column carries no meaning.
Example: five sampling sites
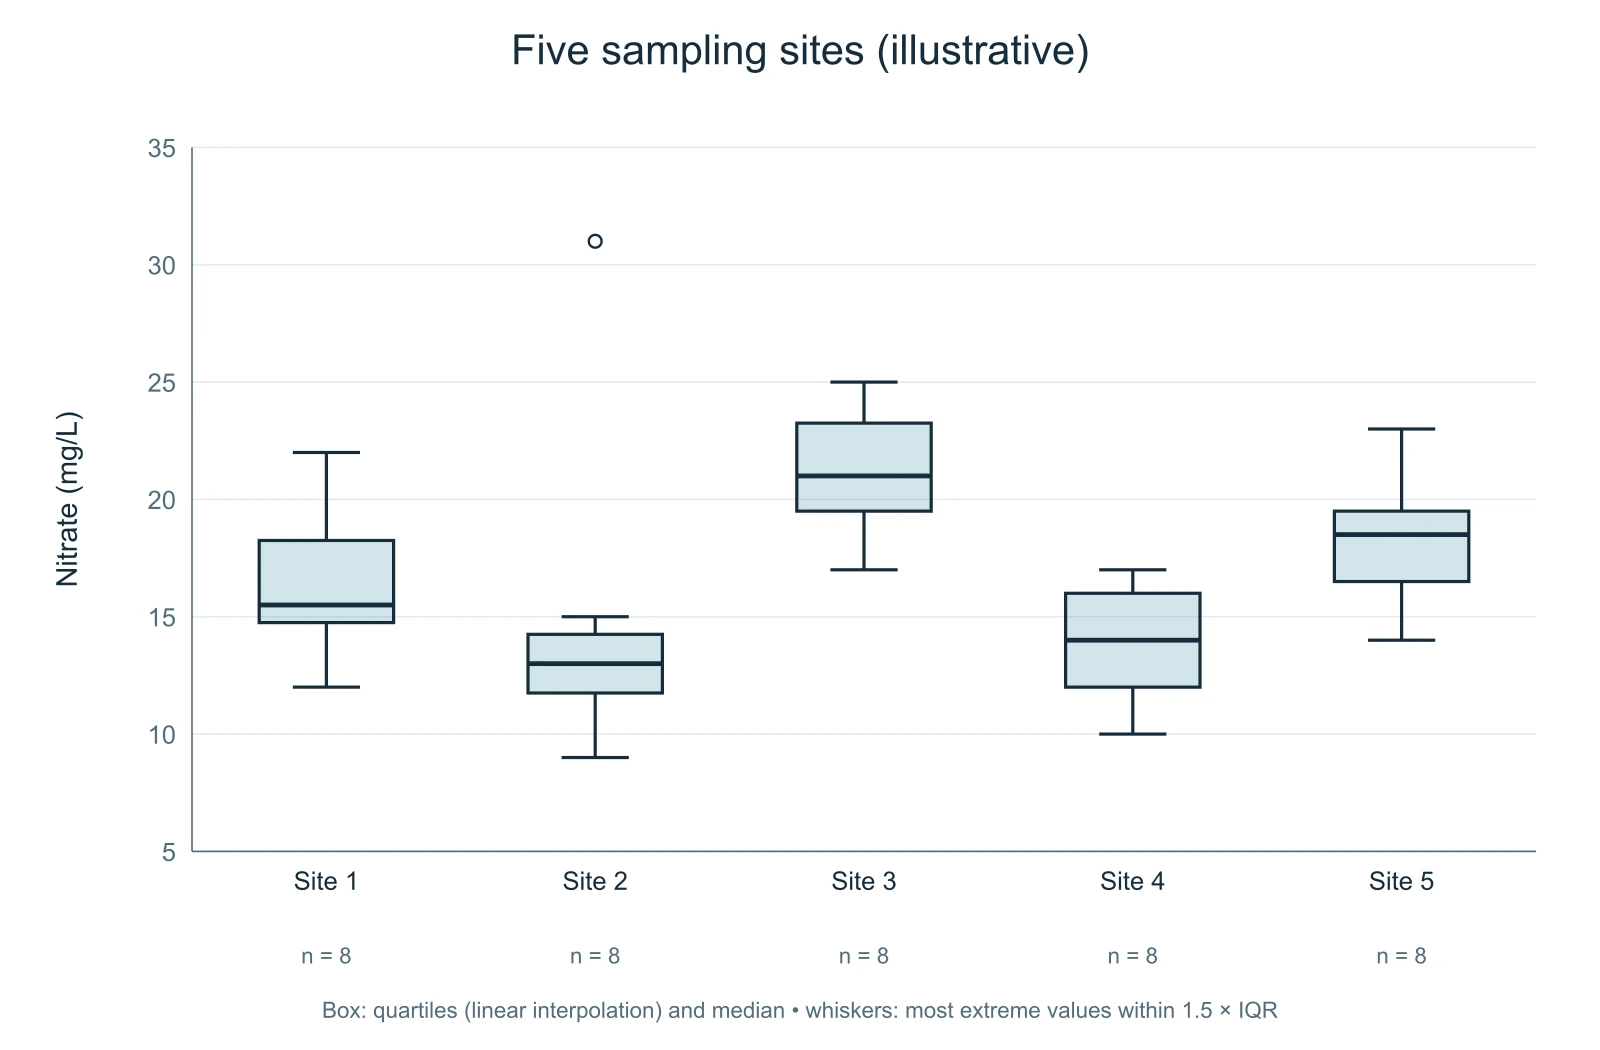
The third example compares nitrate concentrations at five sites with eight illustrative values each. Site 2 contains one value of 31 mg/L, far above the rest of that group, and the Tukey rule marks it as an outlier while the whisker stops at the highest value inside the fence.
An outlier in a box plot is a description, not a verdict. Check whether the value is a measurement error, a different population or a real extreme before deciding how to treat it, and report your decision in the methods.
Choosing the whisker rule
Tukey whiskers are the most common convention in research figures. They extend to the most extreme values within 1.5 times the interquartile range beyond the box, and values outside that range are drawn individually. Readers can see both the bulk of the data and the unusual values. Minimum-to-maximum whiskers are simpler and show the full range, but a single extreme value can stretch the whisker and hide how the rest of the data is spread.
Whichever rule you choose, state it in the figure legend. The note printed under the plot is there to remind you, and you can keep it or move the wording into your legend.
Box plot or bar graph?
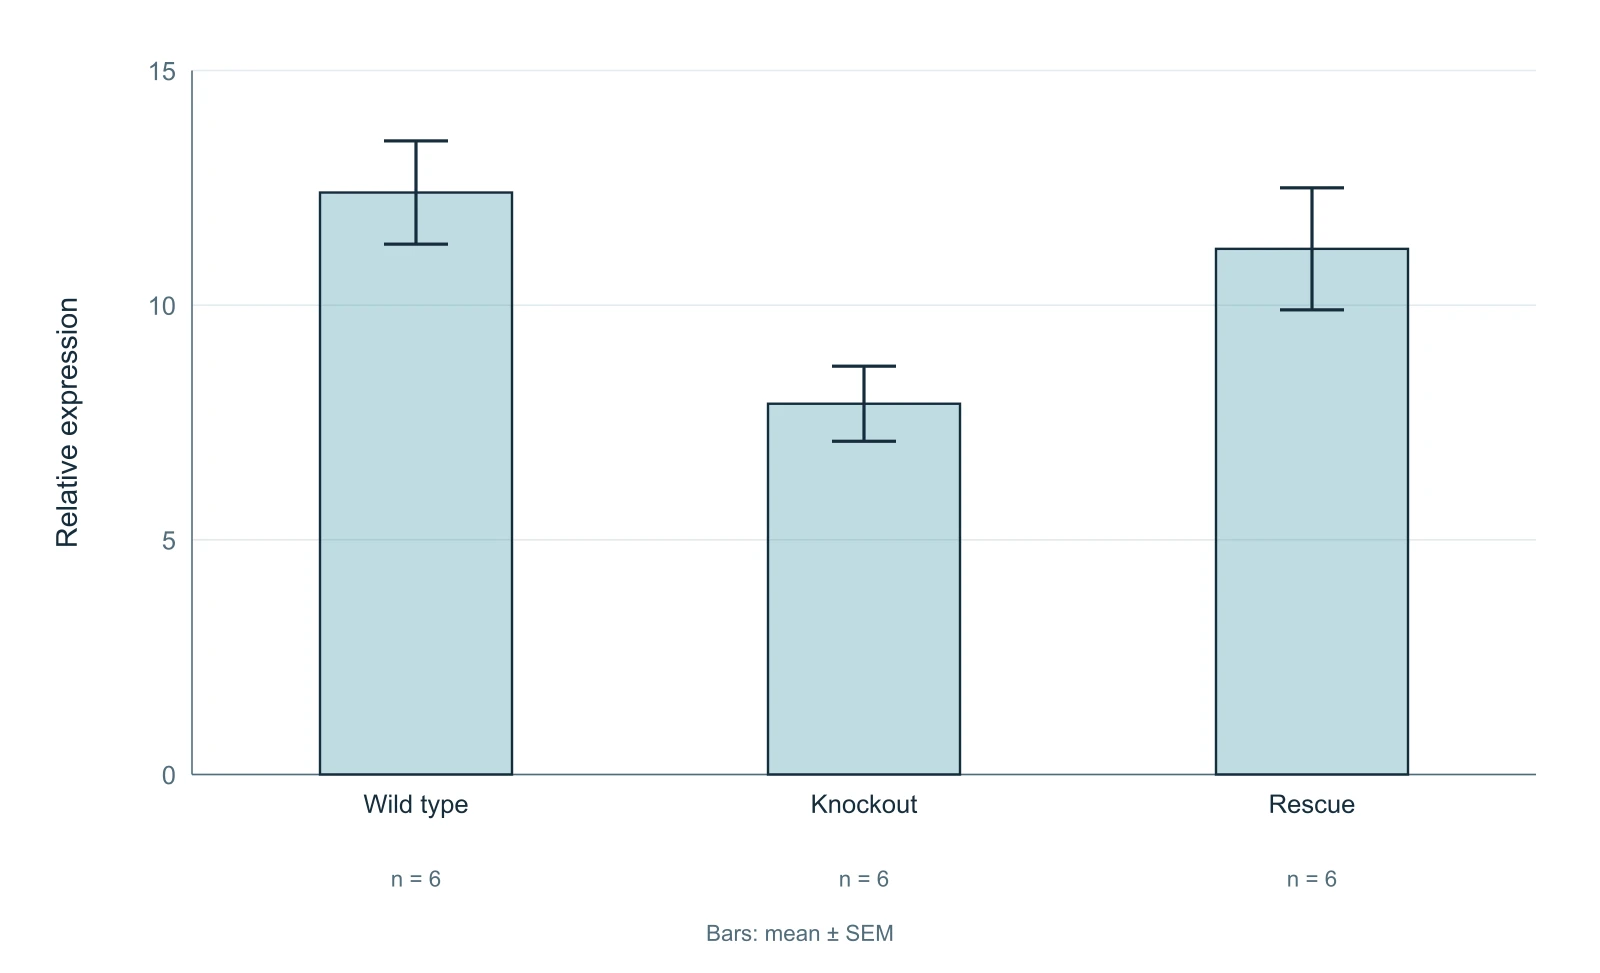
A box plot describes a distribution: its centre, its spread and its asymmetry. A bar graph of means hides all of that and is easily misread when data are skewed or samples are small. Prefer a box plot, ideally with the individual values shown, when your point is about how values are distributed or when groups have fewer than about twenty observations. If you need to show means with error bars, the bar graph with error bars tool on this site can draw them from raw values and overlay the individual points.
Questions about box plots
How are the quartiles calculated?
By linear interpolation between ordered values, the default in R (type 7), NumPy and Excel's QUARTILE.INC. Other software may use a different method and give slightly different quartiles for small samples.
What do the whiskers show?
With the Tukey rule, the most extreme values within 1.5 times the interquartile range beyond the box. With the minimum-to-maximum rule, the smallest and largest values.
Can I paste data from Excel?
Yes. Put the group name, a colon and the copied values on one line; tabs, spaces, commas and semicolons all work as separators. Use a decimal point, not a decimal comma.
How many values can I enter?
Up to twelve groups and 5,000 values in total, with at least three values per group.
Is my data uploaded?
No. The calculations and the drawing happen in your browser.