
Forest plot example
What is a forest plot?
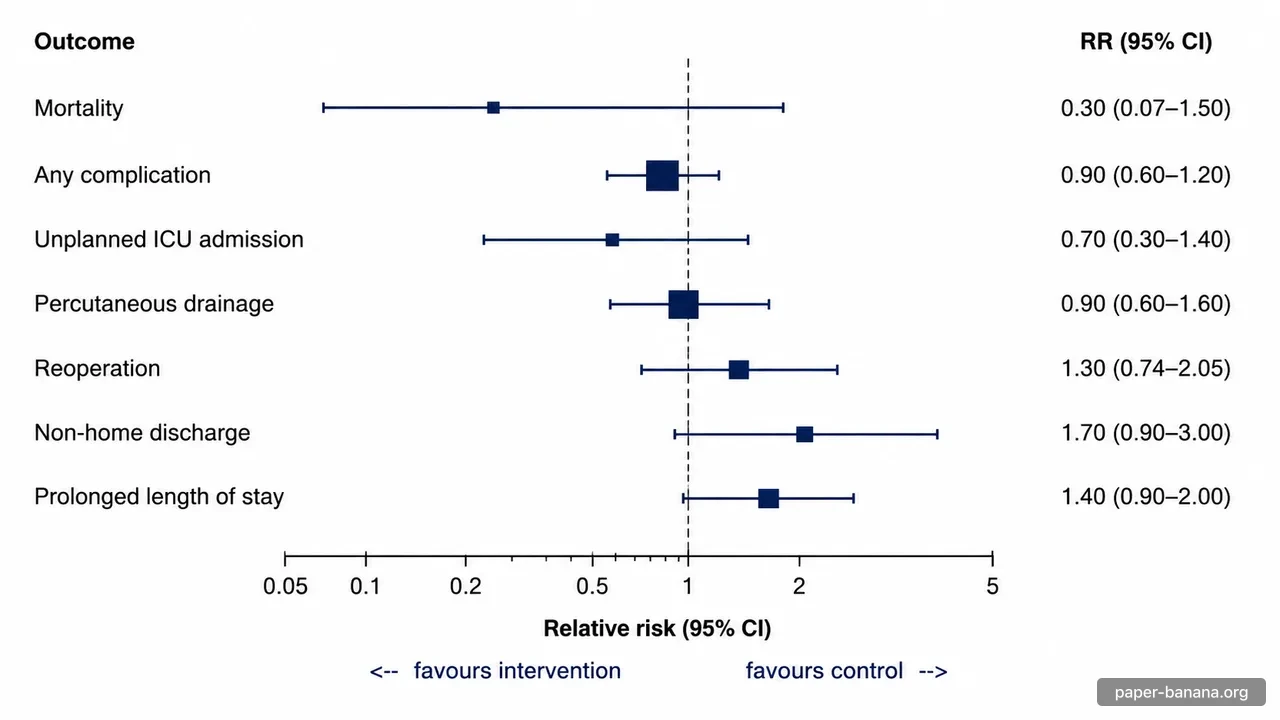
A forest plot shows several effect estimates side by side, each with its confidence interval, against a shared axis. Meta-analyses use it to show every included study and the pooled result in one figure. Regression and subgroup analyses use the same layout to compare variables or patient groups.
How to read a forest plot
- Squares
- Each square is one study's point estimate. In a meta-analysis its size usually reflects the study's weight, so larger squares contribute more to the pooled result.
- Horizontal lines
- The line through each square is its 95% confidence interval. Wide intervals usually mean small studies or few events.
- Line of no effect
- The vertical line sits at 1 for ratios (OR, RR, HR) and at 0 for differences (MD, SMD). An interval that crosses it is not statistically significant at the 5% level.
- Diamond
- The diamond is the pooled estimate. Its centre is the combined effect and its left and right tips are the confidence limits.
- Which side is better
- It depends on the outcome. For a harmful outcome such as mortality, a ratio below 1 favours the intervention. Always read the labels under the axis.
Ratios are drawn on a logarithmic axis so that 0.5 and 2, which are equally large effects in opposite directions, sit the same distance from 1.
AI image or statistical software?
Use this generator for a styled draft: a figure for slides, a poster, or a first look at your results. For the figure you submit with a paper, draw it from your data in statistical software such as R (the metafor and forestplot packages), Stata or RevMan, so every marker sits exactly at its value. Either way, check the numbers in the final image against your analysis.
Forest plot generator FAQ
Is the forest plot generator free?
Building the prompt is free and runs in your browser. Generating the image uses credits: new accounts get 10 free credits, and the cost for your chosen model is shown before you generate.
Is an AI-generated forest plot accurate enough to publish?
Treat it as a draft. Image models can misplace a marker or mistype a number, so compare every row, interval and axis label with your data. For a figure you submit to a journal, the safest source is your statistical software (for example R, Stata or RevMan).
Which effect measures can I use?
Odds ratios, risk ratios and hazard ratios are drawn on a logarithmic axis with the line of no effect at 1. Mean differences and standardized mean differences use a linear axis with the line of no effect at 0.
Can I show subgroups?
Put the subgroup in each label (for example "Age < 60: Study A"), or edit the generated prompt to add bold subgroup header rows and a pooled diamond per subgroup before you insert it.
What happens to my data?
The prompt builder works entirely in your browser. When you generate an image, the prompt with your numbers is sent to create it and is saved in your generation history, like any other prompt.
Related tools
- PRISMA flow diagram generator for the study selection in your systematic review.
- AI scientific figure generator for mechanism diagrams, pipelines and other figures.
- Image DPI calculator to check the resolution your journal asks for.